HackTheBox — LogJammer Sherlock Walkthrough
Windows Event Log Forensics: Investigating Persistence, Malware, and Log Tampering with Event Log Explorer & FLARE‑VM.

Image Credit: https://app.hackthebox.com/sherlocks/LogJammer
Introduction:
Welcome back to another weekly walkthrough! If you’ve stumbled across this blog while searching for a comprehensive guide to the LogJammer Sherlock challenge from Hack The Box, you’re in the right place.
This is the seventh challenge in the Intro to Blue Team track, but you can jump in at any point. If you’re following along or you’re a completionist, check out my write-up of the previous free challenge — Meerkat:
HackTheBox | Meerkat | Sherlock Walkthrough
Challenge Scenario:
You have been presented with the opportunity to work as a junior DFIR consultant for a big consultancy. However, they have provided a technical assessment for you to complete. The consultancy Forela-Security would like to gauge your Windows Event Log Analysis knowledge. We believe the Cyberjunkie user logged in to his computer and may have taken malicious actions. Please analyze the given event logs and report back.
This challenge is all about Windows Event Log Analysis and leans heavily on choosing the correct log, filtering for specific event IDs, and weaving together activity across multiple logs. It’s up to us to meet the moment and show off our event log analysis skills. Don’t worry if you’re new to this topic — I’ll link plenty of helpful resources that you can use in your own investigations.
But having great references is only half the battle. We also need solid tools. For this walkthrough, we’ll rely primarily on Event Log Explorer, a tool that makes filtering, pivoting, and correlating events far faster than using the built‑in Windows Event Viewer. It’s a huge timesaver when you’re staring down thousands of log entries.
So, whether you’re new to Windows endpoint forensics or you just want to sharpen your analysis skills, this is a fantastic challenge to tackle. Let’s go!
And, hey, if you find this walkthrough helpful — whether it levels up your skills, gets you over a stumbling block, or just serves as a handy reference — please consider following me to get more content like this.
Thanks for reading and going on this investigation with me!
Setup the Analysis Environment & Extract the Challenge File:
Safety first! It’s always important when working with lab/challenge files from Hack the Box (or any educational lab/challenge/range) to keep yourself protected by performing these tasks in a dedicated, isolated virtual machine environment. As this is a Windows-based challenge, I’m using FLARE-VM for this challenge which is “a collection of software installations scripts for Windows systems that allows you to easily setup and maintain a reverse engineering environment on a virtual machine (VM).”
To keep this write-up focused I’m going to skip the step-by-step setup of FLARE-VM but _i_f you’d like to set up your own environment, please follow the directions provided directly by FLARE-VM on GitHub.
GitHub — mandiant/flare-vm: A collection of software installations scripts for Windows systems that… _A collection of software installations scripts for Windows systems that allows you to easily setup and maintain a…_github.com
Once you have a safe virtual environment created, updated, isolated, and snapshotted, we can extract the challenge file and start the investigation!
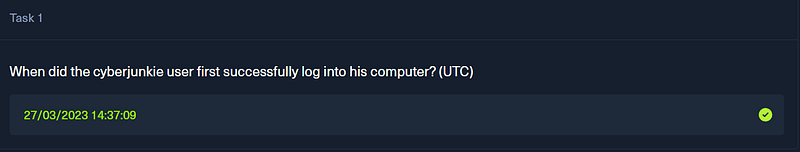
Question 1: When did the cyberjunkie user first successfully log into his computer? (UTC)
Now that we’ve gotten our analysis environment all set up, let’s kick off this investigation by extracting the challenge file and taking a look at the available artifacts.
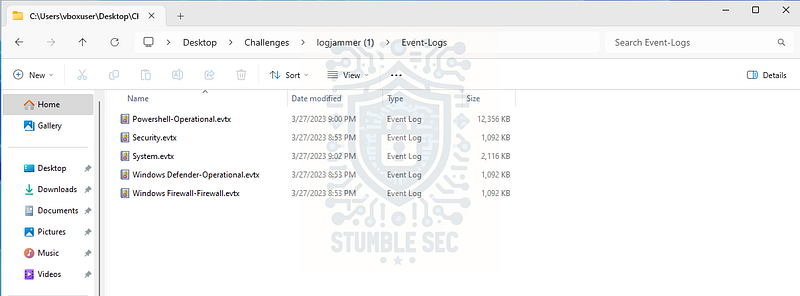
Overview of the challenge artifacts
We have five Event Logs available in this challenge, each providing different insights:
- Powershell‑Operational.evtx: This event log contains “details about PowerShell operations, such as starting and stopping the engine and providers, and executing PowerShell commands.”
- Security.evtx: This event log contains “logs related to logins, privileges, and other similar events.”
- System.evtx: This event log contains “logs created by the operating system.”
- Windows Defender‑Operational.evtx: This event log contains logs related to Microsoft Defender Antivirus operational and malware‑related events.
- Windows Firewall‑Firewall.evtx: This event log contains events related to the Windows Firewall with Advanced Security, including rule additions, modifications, and deletions.
Now that we understand what we’re working with, we can identify the correct log to answer Question 1. Since we’re searching for a sign‑in event, we’ll work directly in the Security log and filter for Event ID 4624 (“An account was successfully logged on”).
You can absolutely use the built‑in Windows Event Viewer, but there’s a more efficient option: Event Log Explorer. Because Event Log Explorer is already installed in the Flare‑VM analysis environment, that’s what I’ll be using in this walkthrough. I encourage you to try it if you aren’t familiar with it — the filtering features save a surprising amount of time.
Steps in Event Log Explorer
- Open Event Log Explorer and load
Security.evtx. - Click the Filter button and enter
4624into the Event ID field. - To narrow this down further, use Description params → select “New Logon\Account Name” → operator: contains → value:
cyberjunkie. - This returns only the successful logons for this user. Sort by time and double‑click the earliest entry.
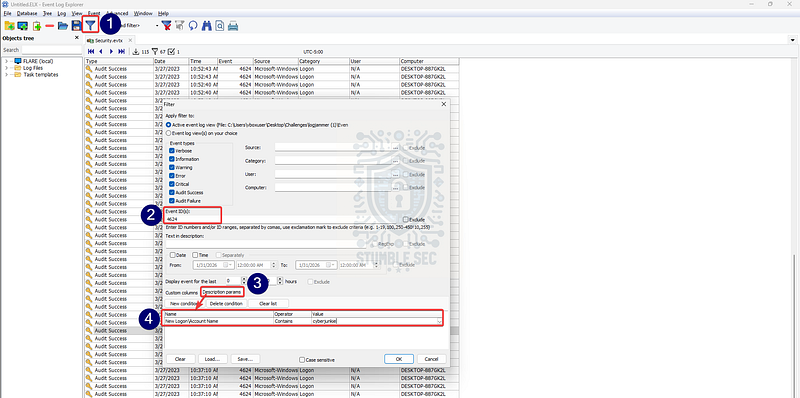
Event Log Explorer: Filtering for 4624 events
With the targeted filter in place, we can stumble straight into the events we need without digging through thousands of unrelated entries. Since we’re searching for the first successful login, open the earliest one. From here, there’s one more thing we need: the UTC timestamp.
- Double-click to open the event.
- Select the XML tab.
- Expand the System node.
- Look for the
TimeCreated > SystemTimeattribute.
The SystemTime value is always stored in UTC and is the timestamp you’ll need for the answer.
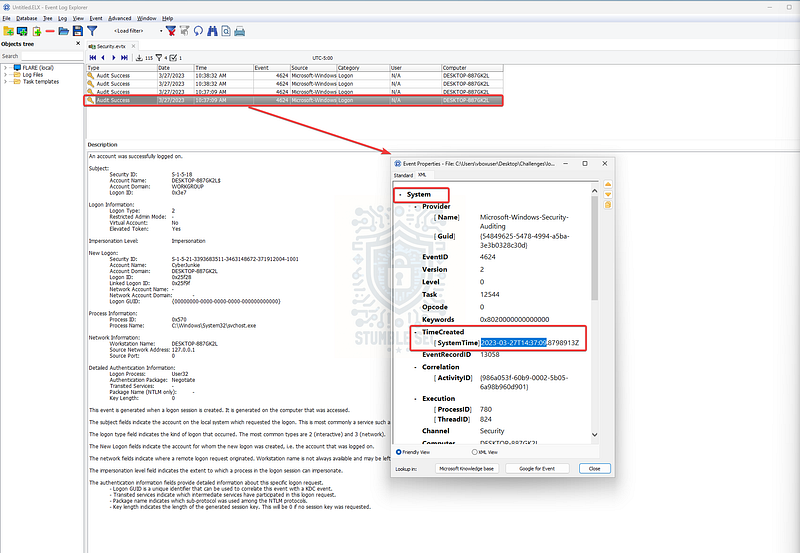
Event Log Explorer: Identifying the logon time in UTC
Now that we’ve successfully identified the cyberjunkie’s first successful logon, we can move on to the next question.
Questions 2 & 3:
The user tampered with firewall settings on the system. Analyze the firewall event logs to find out the Name of the firewall rule added?
Whats the direction of the firewall rule?
Next up, we need to figure out what firewall rule cyberjunkie tampered with. For this step, open the Windows Firewall‑Firewall.evtx artifact in Event Log Explorer. Just like before, there’s plenty of noise in this log, but we can cut through it by focusing on events that occurred after the first cyberjunkie sign‑in on 3/27/2023 at 10:37:09 AM.
Filtering by time quickly helps us identify the events we care about. Near the top of the log, we’ll find an Event ID 2004, which indicates that a rule has been added to the Windows Defender Firewall exception rules.
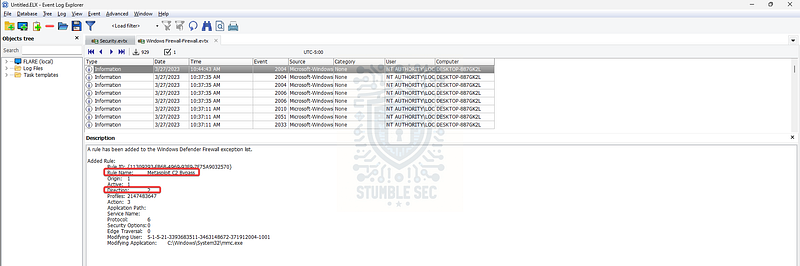
Event Log Explorer: Finding a suspicious firewall exception rule
Opening this event gives us everything we need. The rule name includes the name of a well‑known penetration testing tool: Metasploit. Since this is a challenge scenario, that kind of red-flag naming is intentional and makes the rule easy to spot.
Inside the same event, you’ll also find the Direction attribute, which has a value of 2. In Windows Firewall terminology, that value represents an outbound rule. Finally, we can correlate the ModifyingUser SID to confirm that cyberjunkie is indeed the account responsible for adding it.
Now that we’ve extracted both the rule name and its direction, we’re ready to move on to the next part of the investigation.
Question 4: The user changed audit policy of the computer. Whats the Subcategory of this changed policy?
Our next task is to identify a change to the computer’s audit policy and determine the subcategory that was modified. This is an event I’m not familiar with off‑hand, so this is a good time to pivot and do a little research.
One of my favorite quick‑reference resources for security event IDs is the Ultimate Windows Security Windows Security Log Events Encyclopedia. A simple search for “audit policy” points us toward Event ID 4719, which corresponds to “System audit policy was changed.”
Windows Security Log Event ID 4719 - System audit policy was changed _4719: System audit policy was changed On this page This computer’s system level audit policy was modified - either via…_www.ultimatewindowssecurity.com
Now that we’ve identified the correct event, we can return to Security.evtx in Event Log Explorer and apply a filter for Event ID 4719. This gives us a single event, which makes our job nice and straightforward. We just need to grab the Subcategory value from the event details to answer the question.
Once we extract that field, we’ll have everything we need for Question 4.
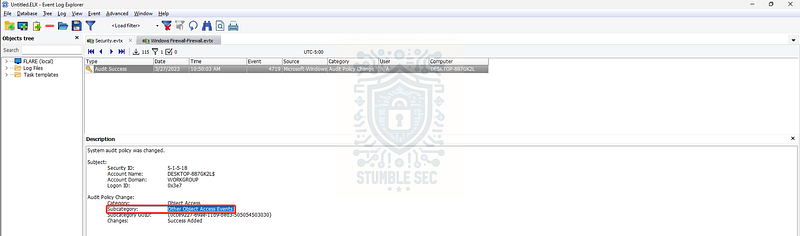
Event Log Explorer: Identifying the subcategory in Event ID 4719
Questions 5, 6, & 7:
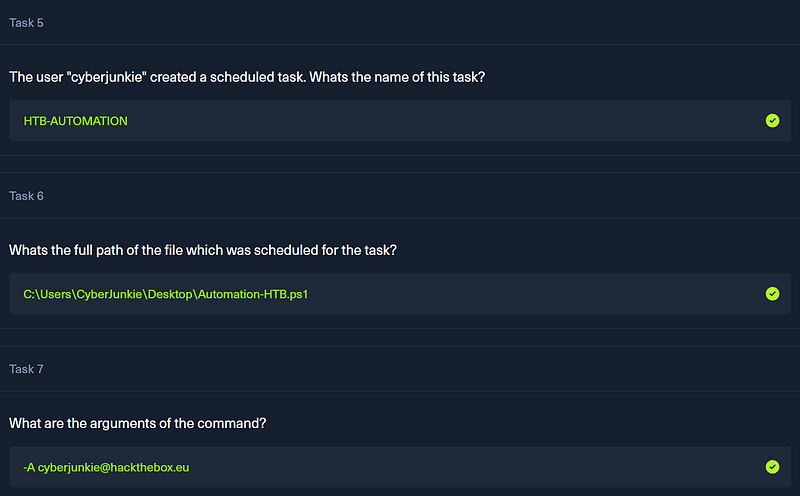
The user “cyberjunkie” created a scheduled task. Whats the name of this task?
Whats the full path of the file which was scheduled for the task?
What are the arguments of the command?
Moving right along, Questions 5, 6, and 7 focus on identifying a scheduled task created by cyberjunkie. This is important because scheduled tasks are a classic persistence technique. An attacker can schedule recurring execution of scripts or binaries to maintain access long after their initial intrusion. This technique maps directly to MITRE ATT&CK Scheduled Task/Job: Scheduled Task (T1053.005).
To investigate this, we’ll turn again to the Ultimate Windows Security Windows Security Log Events Encyclopedia. A quick lookup shows that scheduled task creation is logged as Event ID 4698, which corresponds to “A scheduled task was created.”
Windows Security Log Event ID 4698 - A scheduled task was created _4698: A scheduled task was created On this page The user indicated in Subject: just created a new scheduled task (Start…_www.ultimatewindowssecurity.com
With that information in hand, we return to Security.evtx in Event Log Explorer and adjust our filter to Event ID 4698. Just like in the previous questions, this gives us a single event to review, making the analysis easy.
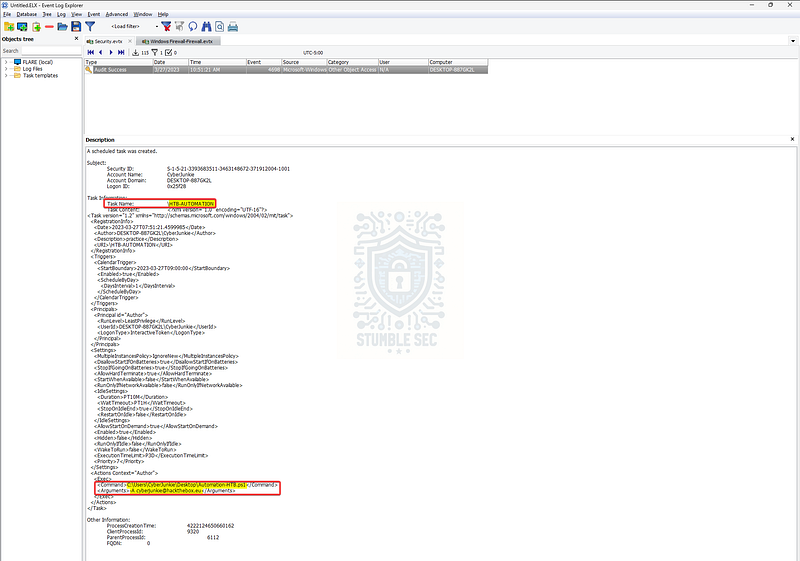
Event Log Explorer: Analyzing the scheduled task
Reviewing the event description reveals everything we need to answer all three questions:
- The name of the scheduled task
- The full path to the PowerShell script (
Automation-HTB.ps1) - The command‑line arguments used when the task was created
Once we extract those details, we’ve successfully solved Questions 5, 6, and 7 — and we’re ready to stumble into the next part of the investigation.
Questions 8, 9, & 10:
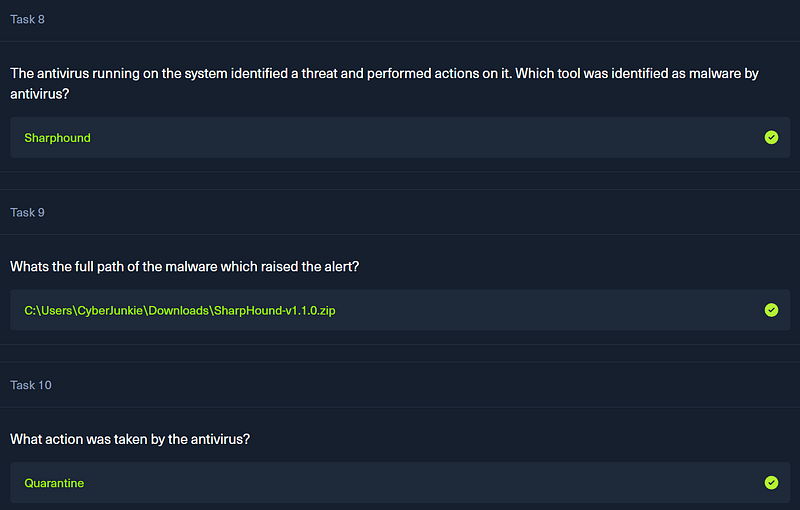
The antivirus running on the system identified a threat and performed actions on it. Which tool was identified as malware by antivirus?
Whats the full path of the malware which raised the alert?
What action was taken by the antivirus?
Questions 8, 9, and 10 all focus on malware detection activity on the compromised device. To answer them, we’ll work with the Windows Defender‑Operational.evtx artifact, which contains logs related to Microsoft Defender Antivirus operational and malware‑related events.
Load this artifact into Event Log Explorer. For this investigation, we’ll filter for Event IDs 1116 and 1117. According to Microsoft Learn, these correspond to:
1116— MALWAREPROTECTION_STATE_MALWARE_DETECTED1117— MALWAREPROTECTION_STATE_MALWARE_ACTION_TAKEN
Even though this log contains a lot of noise, we can narrow things down again by focusing only on events that occurred after the first cyberjunkie login. Doing this drops us down to only four events: two detections (1116) and two actions (1117).
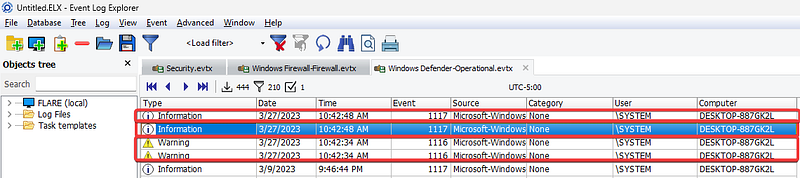
Event Log Explorer: Defender events after the threat actor sign-in
Looking at the 1116 events, we see that Microsoft Defender detected two components of SharpHound (SharpHound.ps1 and SharpHound.exe). SharpHound is the ingestor module for BloodHound, a well‑known Active Directory reconnaissance tool frequently used by red teams and attackers. Both files were bundled together in a single .zip archive, and the detection explicitly references that tool — which answers Question 8.
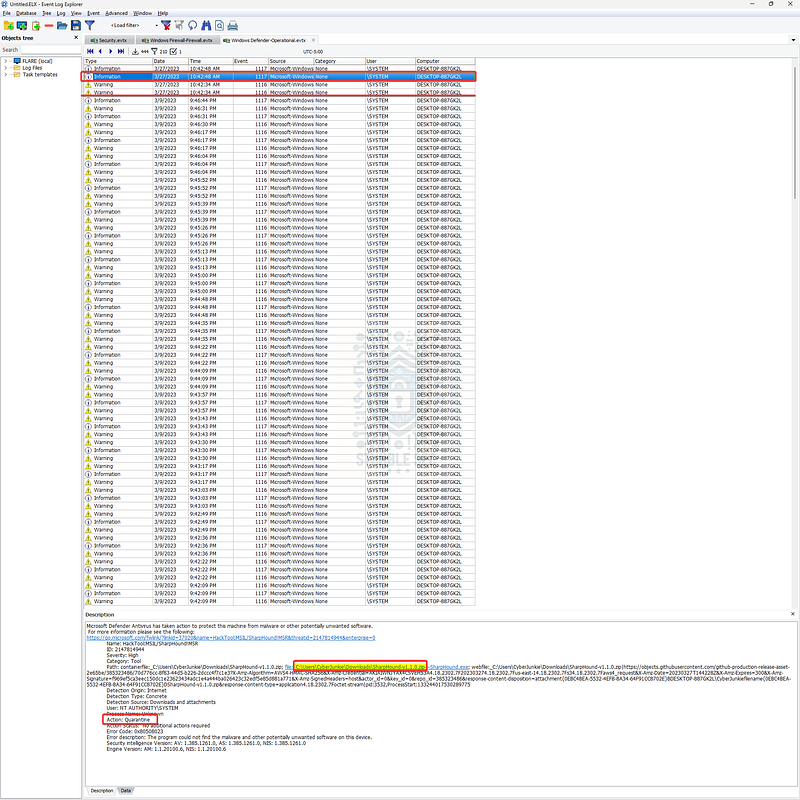
Event Log Explorer: Identifying SharpHound activity through the Windows Defender Logs
To answer Questions 9 and 10, we can check either of the 1117 events. These entries provide:
- The full path where the malware files were located
- The action taken by the antivirus engine
With this information, we can fully resolve all three questions!
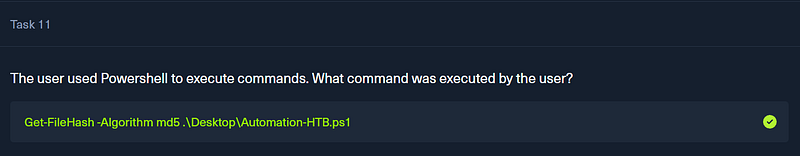
Question 11: The user used Powershell to execute commands. What command was executed by the user?
We’re nearing the end of this investigation, but we still have a few artifacts left to analyze. This time, we’ll pivot to the Powershell‑Operational.evtx log. As before, load the log into Event Log Explorer so we can filter the entries and focus only on events from the date of the attack.
In the filter options, select the date checkbox and set both the From and To values to 3/27/2023.
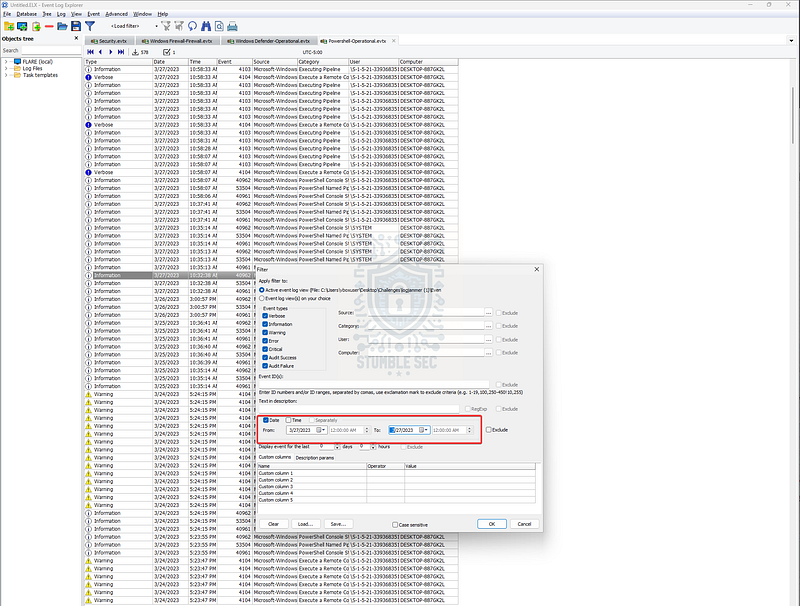
Event Log Explorer: Filtering the PowerShell log for the date of the attack
Because this device has PowerShell script block logging enabled, we can home in on Event ID 4104 to collect insights into what commands were executed. Event ID 4104 records script block content, which often includes some handy forensic data like the full command line used in a PowerShell session. Check it out:
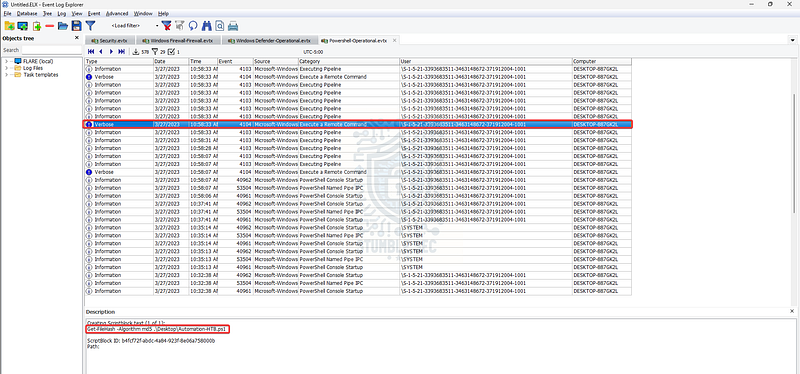
Event Log Explorer: Identifying the Script Block Contents
The second event gives us the full command. In this case, cyberjunkie executed a PowerShell command to determine the MD5 hash of the Automation-HTB.ps1 script we identified back in Question 6. It’s not the most exciting example of an attacker command, but it’s still a great demonstration of how much forensic insight script block logging can provide.
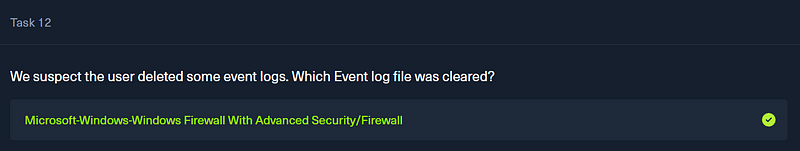
Question 12: We suspect the user deleted some event logs. Which Event log file was cleared?
And finally, we’ve made it to the end of our investigation. To answer Question 12, we’re looking for signs that the attacker attempted to cover their tracks by deleting event logs. Tampering with logs is a classic indicator removal technique and maps directly to MITRE ATT&CK — Clear Windows Event Logs (T1070.001).
There are two locations we need to check. The first is the Security.evtx log. Here, we can filter for Event ID 1102, which corresponds to “The audit log was cleared.”
Windows Security Log Event ID 1102 - The audit log was cleared _1102: The audit log was cleared On this page Event 1102 is logged whenever the Security log is cleared, REGARDLESS of…_www.ultimatewindowssecurity.com
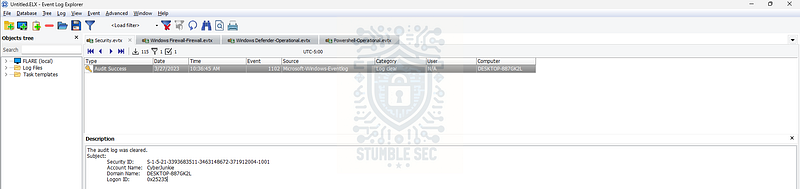
Event Log Explorer: Event ID 1102
While this confirms that the Security log was indeed cleared, this isn’t the answer we’re looking for. The question asks which Event Log file was cleared, and 1102 only tells us the Security log was wiped, but the challenge data suggests additional tampering.
That brings us to the artifact we haven’t touched yet: the System.evtx log.
Load System.evtx into Event Log Explorer and filter for Event ID 104, which corresponds to “[Other log file cleared](https://learn.microsoft.com/en-us/windows/security/operating-system-security/device-management/use-windows-event-forwarding-to-assist-in-intrusion-detection#appendix-e---
annotated-baseline-subscription-event-query).” This event is generated when any log except the Security log is cleared.
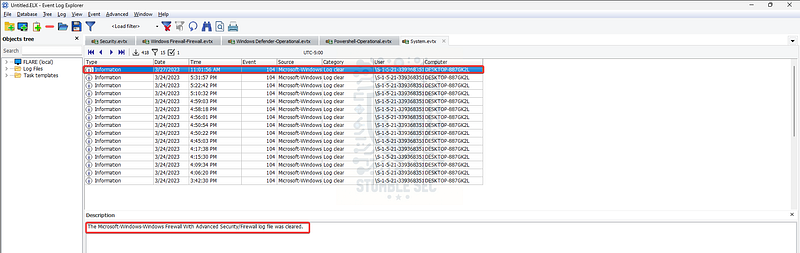
Event Log Explorer: Identifying the cleared log file with Event ID 104
Bingo. The top event from the day of the attack shows exactly what we need. Event ID 104 reveals that the attacker cleared the Microsoft-Windows-Windows Firewall with Advanced Security/Firewall log.
With this final piece of the puzzle, we’ve wrapped up the investigation and uncovered an attempt by cyberjunkie to cover his tracks by wiping the event logs. Nice work!
Conclusion:

How fun was that! A big thank you to Hack The Box for another fantastic challenge.
This challenge was another awesome entry in the Intro to Blue Team track with a tight focus on Windows Event Log Analysis, correlating activity across multiple logs, filtering specific event IDs, and piecing together the cyberjunkie user’s actions step‑by‑step.
As we moved through the investigation, we followed the attacker’s trail across authentication events, firewall tampering, audit policy changes, scheduled task creation, malware detections, script block execution, and even attempts at covering their tracks through log clearing. Each question built naturally into the next, creating a clear and logical narrative that mirrors real‑world DFIR work. It was a great reminder of how much visibility Windows logs provide — if we know where to look.
I chose this week’s challenge to brush up on some Event IDs I don’t use every day, add a few new ones to my notebook (which I’ve added in the quick reference below), and sharpen my workflow using Event Log Explorer. It’s always a cool experience to piece together an attack using only a handful of logging artifacts. It just goes to show how powerful proper log analysis can be when it comes to uncovering malicious activity. Great stuff!
Thanks for your support and partnering on this investigation. If you found this walkthrough helpful — please give it a clap and consider following me! Your feedback is invaluable, and it pumps me up to support your security journey. Remember, cybersecurity is a team sport, and we’re in this together!
Until next week’s challenge — stay curious and be safe out there!

Quick Reference: Event IDs we covered
4624— Successful logon (Security.evtx). Use New Logon\Account Name in Event Log Explorer to pinpoint the user2004— Windows Defender Firewall rule added (Windows Firewall‑Firewall.evtx). Includes rule name, direction, and modifying user SID4719— System audit policy changed (Security.evtx). Look for Subcategory and related GUIDs4698— Scheduled task created (Security.evtx). Task XML reveals<Command>and<Arguments>1116— Malware detected (Windows Defender‑Operational.evtx). Threat name and often the container path1117— Malware action taken (Windows Defender‑Operational.evtx). Action such as Quarantined, Removed, or Blocked4104— PowerShell Script Block Logging (Powershell‑Operational.evtx). Captures script block contents and the full command line1102— Security log cleared (Security.evtx). Indicates the audit log was wiped104— Other Windows log cleared (System.evtx). Specifies the exact channel, e.g., Microsoft‑Windows‑Windows Firewall with Advanced Security/Firewall
Tools & References:
Challenge Link: https://app.hackthebox.com/sherlocks/LogJammer
Flare-VM: https://github.com/mandiant/flare-vm
Ultimate IT Security — Windows Security Log Events: https://www.ultimatewindowssecurity.com/securitylog/encyclopedia/default.aspx
Microsoft Learn — about_Logging_Windows: https://learn.microsoft.com/en-us/powershell/module/microsoft.powershell.core/about/about_logging_windows?view=powershell-7.5
Microsoft Tech Community — Windows Events, how to collect them in Sentinel and which way is preferred to detect Incidents: https://techcommunity.microsoft.com/blog/fasttrackforazureblog/windows-events-how-to-collect-them-in-sentinel-and-which-way-is-preferred-to-det/3997342
Microsoft Learn — Review event logs and error codes to troubleshoot issues with Microsoft Defender Antivirus: https://learn.microsoft.com/en-us/defender-endpoint/troubleshoot-microsoft-defender-antivirus
Microsoft Learn — Configure Windows Firewall logging: https://learn.microsoft.com/en-us/windows/security/operating-system-security/network-security/windows-firewall/configure-logging?tabs=intune
Microsoft Learn — 4624(S): An account was successfully logged on: https://learn.microsoft.com/en-us/previous-versions/windows/it-pro/windows-10/security/threat-protection/auditing/event-4624
MITRE ATT&CK — Scheduled Task/Job: Scheduled Task (T1053.005): Scheduled Task/Job: Scheduled Task, Sub-technique T1053.005 — Enterprise | MITRE ATT&CK®
MITRE ATT&CK — Software — BloodHound (S0521): https://attack.mitre.org/software/S0521/
MITRE ATT&CK — Indicator Removal: Clear Windows Event Logs (T1070.001): https://attack.mitre.org/techniques/T1070/001/
Microsoft Learn — Use Windows Event Forwarding to help with intrusion detection: https://learn.microsoft.com/en-us/windows/security/operating-system-security/device-management/use-windows-event-forwarding-to-assist-in-intrusion-detection