HackTheBox: Campfire-1 Sherlock Walkthrough
Detecting Kerberoasting Activity: Correlating Kerberos Events, PowerShell Logs, and Prefetch Artifacts

Image Credit: https://app.hackthebox.com/sherlocks/Campfire-1?tab=play_sherlock
Introduction:
Welcome to my weekly walkthrough! If you’ve stumbled across this blog while looking for a detailed guide to the Campfire-1 Sherlock from Hack The Box, you’re in the right place.
This is the first challenge in the Detecting Active Directory Attacks track and it wastes no time dropping us into a classic blue team scenario.
For this walkthrough, we’re given a collection of forensic artifacts, including Domain Controller security logs, PowerShell operational logs from the affected workstation, and Windows Prefetch files. From there, it’s on us to reconstruct the attack and figure out what actually happened in the environment.
Along the way, we’ll bust out a handful of tools, including Event Log Explorer, PECmd, and Timeline Explorer, and map what we find back to MITRE ATT&CK to add some helpful context. Going hands‑on with a broad set of tools like this is a great way to get experience with multiple utilities and compare how each one shines during different phases of an investigation.
And hey, if you find this walkthrough helpful, whether it helps you level up your memory forensics skills, gets you over a stumbling block, or just serves as a useful reference, consider following me for more weekly deep dives.
Thanks for reading and going on this investigation with me. Let’s go!
Challenge Scenario:
Alonzo Spotted Weird files on his computer and informed the newly assembled SOC Team. Assessing the situation it is believed a Kerberoasting attack may have occurred in the network. It is your job to confirm the findings by analyzing the provided evidence.
You are provided with:
1- Security Logs from the Domain Controller
2- PowerShell-Operational Logs from the affected workstation
3- Prefetch Files from the affected workstation
Setup the Analysis Environment & Extract the Challenge File:
Safety first! It’s always important when working with lab/challenge files from HtB (or any educational lab/challenge/range) to keep yourself protected by performing these tasks in a dedicated, isolated virtual machine environment. As this is a Windows-based challenge, I’m using FLARE-VM for this challenge which is “a collection of software installations scripts for Windows systems that allows you to easily setup and maintain a reverse engineering environment on a virtual machine (VM).”
To keep this write-up focused I’m going to skip the step-by-step setup of FLARE-VM but _i_f you’d like to set up your own environment, please follow the directions provided directly by FLARE-VM on GitHub.
GitHub — mandiant/flare-vm: A collection of software installations scripts for Windows systems that… _A collection of software installations scripts for Windows systems that allows you to easily setup and maintain a…_github.com
Once you have a safe virtual environment created, updated, isolated, and snapshotted, we can extract the challenge file and start the investigation!
Kerberoasting Primer:
Before we jump too far into the investigation, let’s lay some groundwork and do a quick recap of Kerberoasting in the context of domain authentication. This will help us contextualize what we’re looking at as we move through the evidence and hopefully avoid stumbling over assumptions later on.
At a high level, the attacker already has valid domain credentials. With those credentials, they can request a Kerberos service ticket for another account that has a registered Service Principal Name or SPN. These SPNs are typically associated with service accounts. Because Kerberos is designed to allow any authenticated domain user to request service tickets, the attacker can ask the domain controller for tickets tied to these exposed service accounts.
If the service account is protected by a weak password, especially if a legacy encryption algorithm like RC4 is still in use, the attacker can take the resulting ticket offline and attempt to brute force it. If successful, this might give them valid service account credentials. From there, lateral movement or privilege escalation becomes much easier, depending on how that account is configured in the domain.
MITRE ATT&CK describes the technique like this:
Adversaries may abuse a valid Kerberos ticket-granting ticket (TGT) or sniff network traffic to obtain a ticket-granting service (TGS) ticket that may be vulnerable to Brute Force.1(https://github.com/EmpireProject/Empire/blob/master/data/module_source/credentials/Invoke-Kerberoast.ps1)2(https://adsecurity.org/?p=2293)
Service principal names (SPNs) are used to uniquely identify each instance of a Windows service. To enable authentication, Kerberos requires that SPNs be associated with at least one service logon account (an account specifically tasked with running a service3(https://blogs.technet.microsoft.com/motiba/2018/02/23/detecting-kerberoasting-activity-using-azure-security-center/)).
Adversaries possessing a valid Kerberos ticket-granting ticket (TGT) may request one or more Kerberos ticket-granting service (TGS) service tickets for any SPN from a domain controller (DC).1(https://github.com/EmpireProject/Empire/blob/master/data/module_source/credentials/Invoke-Kerberoast.ps1)2(https://adsecurity.org/?p=2293) Portions of these tickets may be encrypted with the RC4 algorithm, meaning the Kerberos 5 TGS-REP etype 23 hash of the service account associated with the SPN is used as the private key and is thus vulnerable to offline Brute Force attacks that may expose plaintext credentials.
Not good. But understanding this flow is exactly what we need as we move into the investigation.
MITRE ATT&CK also provides helpful detection guidance (DET0157) and recommends:
Monitoring for anomalous Kerberos TGS requests (Event ID 4769) with RC4 encryption (etype 0x17), accounts requesting an unusual number of service tickets in a short period, or service accounts targeted outside normal usage baselines. Also correlates suspicious process activity (e.g., Mimikatz invoking LSASS access) with Kerberos ticket anomalies.
In other words, by combining these telemetry points and using them as the basis of our investigation, we can more confidently spot Kerberoasting activity and scope its impact. Let’s give it a shot.
Question 1: Analyzing Domain Controller Security Logs, can you confirm the UTC date & time when the kerberoasting activity occurred?
Let’s kick off our investigation by extracting the challenge artifact, campfire-1.zip, which leaves us with a folder named Triage. Inside that folder, we’re given both Domain Controller artifacts and Workstation artifacts.
For the Domain Controller evidence, we’ve got a Windows Security Event log named security.evtx. This log contains, among many other things, authentication and ticket‑granting activity related to the domain. Since the question is asking us to confirm Kerberos‑related activity, this is a logical place to start.
While we could analyze this log using the built‑in Windows Event Viewer, for this walkthrough I’m using Event Log Explorer, a third‑party utility that significantly speeds up filtering and navigation during event log analysis. It’s already installed in my lab environment, and for investigations like this, it’s hard to beat.
Once Event Log Explorer is open, load the Domain Controller security.evtx. From here, we can apply the MITRE ATT&CK detection guidance we discussed in the Kerberoasting primer and put it directly into practice.
To do that:
- Click the Filter button in the toolbar
- Add Event ID
[4769](https://learn.microsoft.com/en-us/previous-versions/windows/it-pro/windows-10/security/threat-protection/auditing/event-4769)(A Kerberos service ticket was requested) - Select Description Params
- Locate Additional Information\Ticket Encryption Type
- Set the operator to Equal
- Add the value
0x17(RC4 encryption)
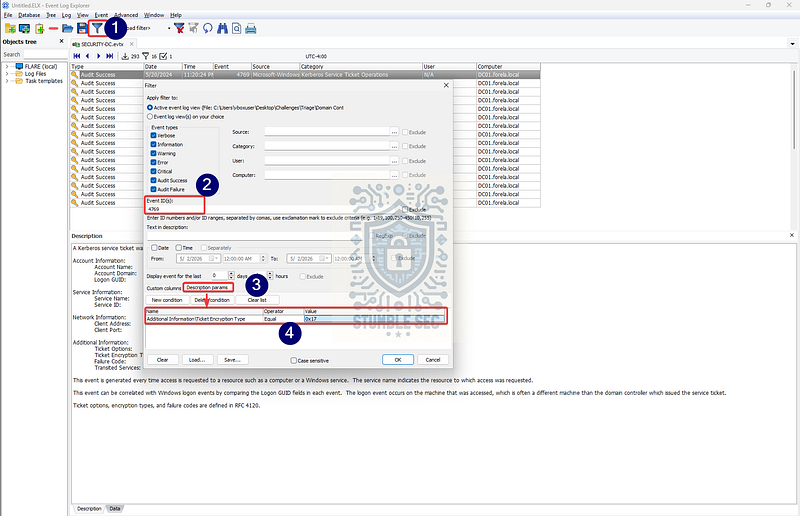
Event Log Explorer: Applying the MITRE ATT&CK detection filters to our log
After applying this filter, we’re left with exactly one matching event. That’s a strong signal and, conveniently, it’s all we need to answer Question 1.
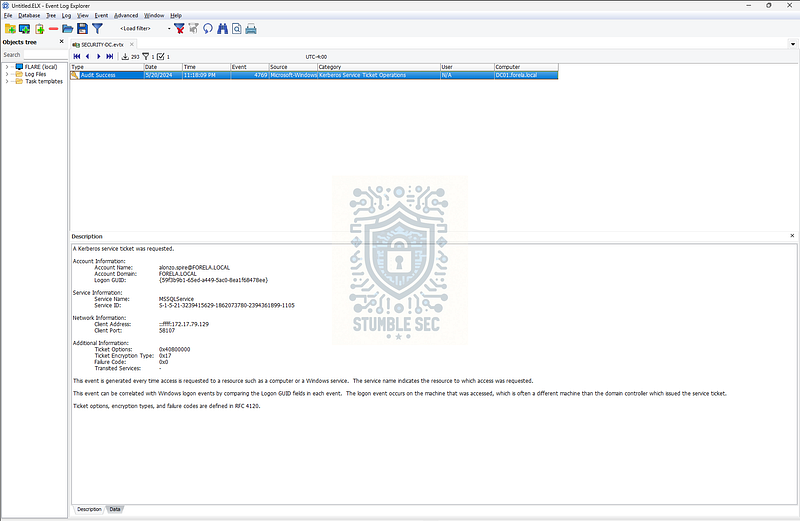
Event Log Explorer: Pinpointing the matching event
There’s one final detail to pay attention to. The question specifically asks for the UTC date and time. Event Viewer and many third‑party tools often display timestamps in local time by default, which can easily trip you up if you’re not careful.
To get the authoritative timestamp, double‑click the event, open the XML tab, and look for the <SystemTime> field. This value is recorded in UTC and removes any ambiguity around time zone conversion.
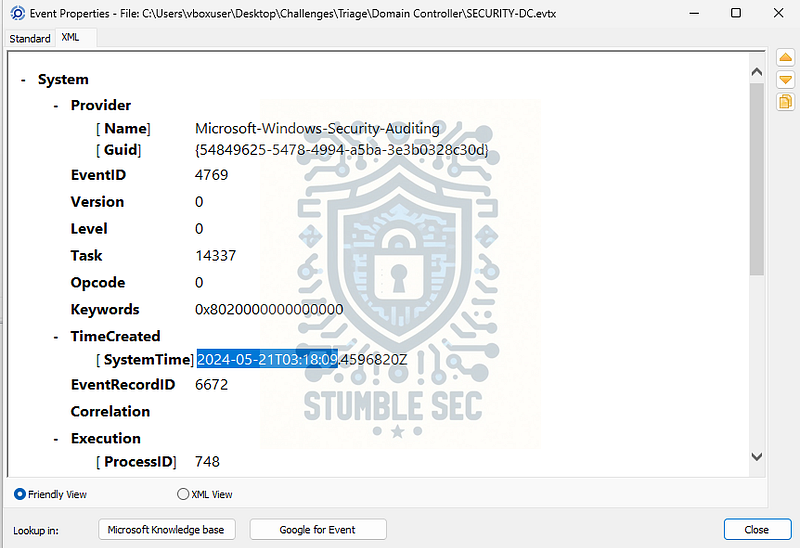
Event Log Explorer: Drilling into event properties to find the UTC SystemTime value
At this point, we’ve isolated the Kerberos service ticket request that matches known Kerberoasting indicators and identified the precise UTC timestamp associated with it. With that information in hand, we can confidently answer Question 1 and move forward with the investigation.
Questions 2 & 3:
What is the Service Name that was targeted?
It is really important to identify the Workstation from which this activity occurred. What is the IP Address of the workstation?
To answer Questions 2 & 3, we need to look a bit more closely at the event we identified in Question 1. Specifically, we’re going to examine the Description details for that Kerberos service ticket request. There’s a wealth of useful forensic information here, but for now we’re focused on two things: the service that was targeted and the workstation that made the request.
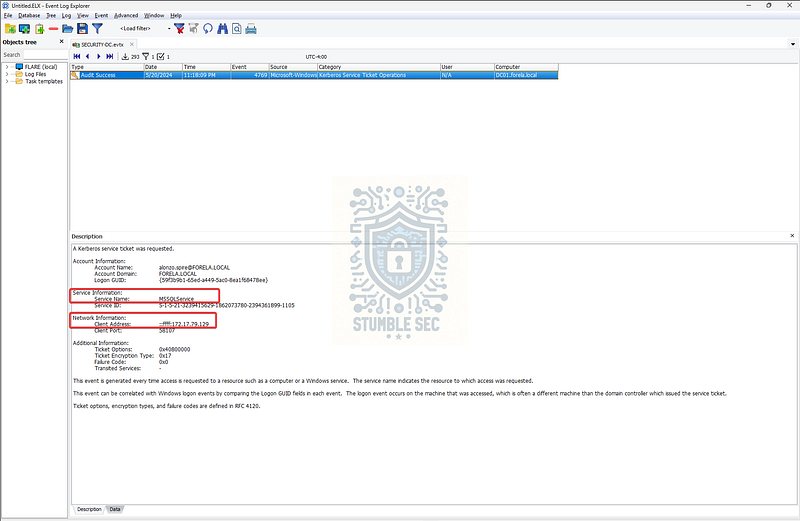
Event Log Explorer: Identifying the targeted service account and requesting client address
If you recall from the primer, I mentioned that service accounts are the ones that typically have registered Service Principal Names. We can see that pattern clearly in this event. Under Service Information, the Service Name field shows MSSQLService. That immediately stands out because MSSQLService is the SPN used by Microsoft SQL Server to authenticate database services. This fits neatly into the expected attack chain.
That gives us our answer for Question 2.
Next, we need to identify the workstation responsible for making this request. This information lives a bit further down in the same event under Network Information. Here we can see the Client Address, which records the IPv4 address of the system that requested the service ticket.
In this case, the address listed is 172.17.79.129. That tells us exactly where the request originated from and gives us a starting point for pivoting into the workstation‑side artifacts later in the investigation.
With the targeted service identified and the requesting workstation pinned down, we’ve now answered Questions 2 & 3 and set ourselves up nicely for the next phase of analysis.
Questions 4 & 5:
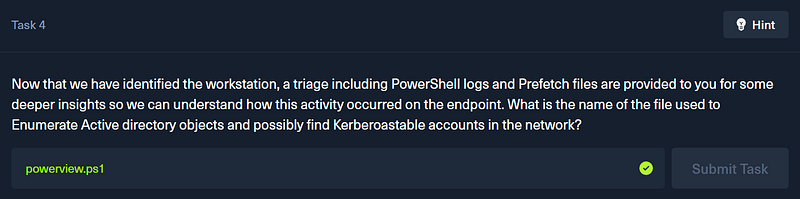
Now that we have identified the workstation, a triage including PowerShell logs and Prefetch files are provided to you for some deeper insights so we can understand how this activity occurred on the endpoint. What is the name of the file used to Enumerate Active directory objects and possibly find Kerberoastable accounts in the network?
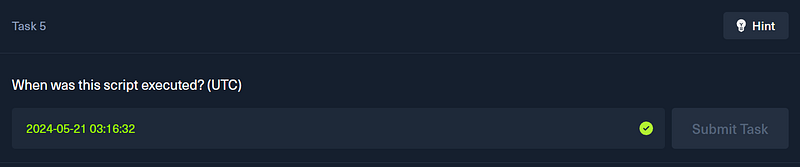
When was this script executed? (UTC)
Moving right along, the next thing we need to tackle is figuring out exactly which tool was used on the workstation to enumerate Active Directory objects and discover Kerberoastable accounts with exposed SPNs. For that, we’ll pivot away from the Domain Controller and jump over to the workstation artifacts.
The first artifact we’ll look at is the PowerShell-Operational.evtx log. This log records PowerShell operational activity, including cmdlet execution and script content via Script Block Logging. That makes it an excellent data source when we suspect malicious PowerShell activity on an endpoint.
Jump back into Event Log Explorer and load PowerShell-Operational.evtx. From here, we’ll focus on Event ID 4104, which corresponds to PowerShell Script Block Logging. This event type often exposes exactly what code was executed, even if the script itself was run from disk or memory.
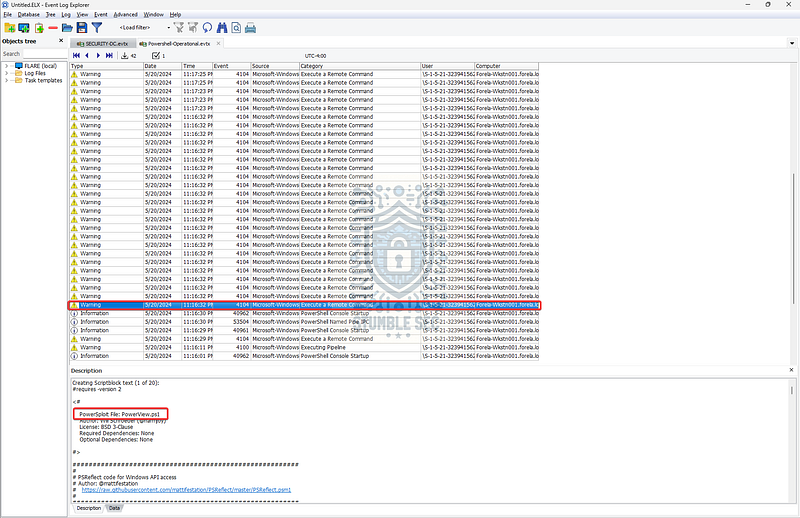
Event Log Explorer: Finding evidence of PowerView execution
The evidence shows up across multiple 4104 events, but by navigating to the earliest occurrences, we can see where this activity began. In those initial events, the script content clearly references powerview.ps1.
For context, PowerView is a reconnaissance module that’s part of PowerSploit, an open‑source offensive PowerShell framework. PowerView is used for domain enumeration tasks such as identifying user accounts, group memberships, and service accounts with SPNs. In other words, a very common tool used to discover Kerberoastable accounts during the discovery phase of an attack. This gives us what we need to answer Question 4.
PowerSploit _PowerSploit is an open source, offensive security framework comprised of PowerShell modules and scripts that perform a…_attack.mitre.org
Since we’ve also identified the first Script Block Logging event that references this file, we now have what we need to answer Question 5 as well. As before, the question asks for the execution time in UTC, so we can’t rely on the default timestamp shown in the event viewer.
To get the correct value, double‑click the event, switch to the XML tab, and locate the <SystemTime> field.
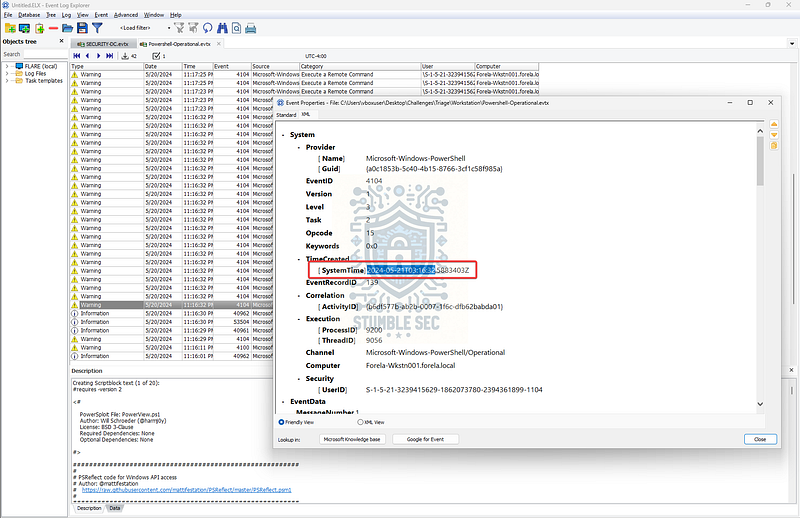
Event Log Explorer: Grabbing the timestamp of PowerView execution
With the tool identified and the execution time confirmed, we’ve now answered Questions 4 & 5 and established how the attacker enumerated Active Directory from the endpoint.
Questions 6 & 7:
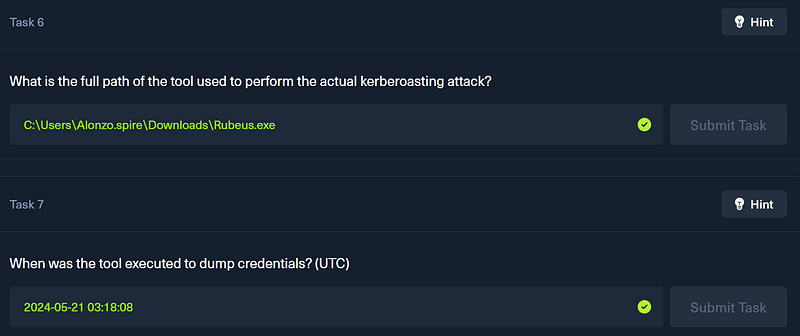
What is the full path of the tool used to perform the actual kerberoasting attack?
When was the tool executed to dump credentials? (UTC)
Our final pair of tasks is to figure out the tool that the attacker actually ran to perform the Kerberoasting attack against the Domain Controller. To do that, we’ll pivot away from event logs entirely and turn to our third forensic artifact: Windows Prefetch files.
These files are located under the following directory in the challenge artifacts:
\Triage\Workstation\2024-05-21T033012_triage_asset\C\Windows\prefetch
Rather than reinvent the wheel explaining what these are and their value, I’ll borrow a solid explanation from Magnet Forensics:
Prefetch files are great artifacts for forensic investigators trying to analyze applications that have been run on a system. Windows creates a prefetch file when an application is run from a particular location for the very first time. This is used to help speed up the loading of applications. For investigators, these files contain some valuable data on a user’s application history on a computer.
The idea here is that if we can parse these Prefetch files, we should be able to identify which executable was launched on the workstation during the attack window and determine its file path. This gives us visibility into the actual Kerberoasting tool used, even if it didn’t leave obvious footprints elsewhere.
The downside is that Prefetch files aren’t meant to be read directly, so we need a way to convert them into something usable.
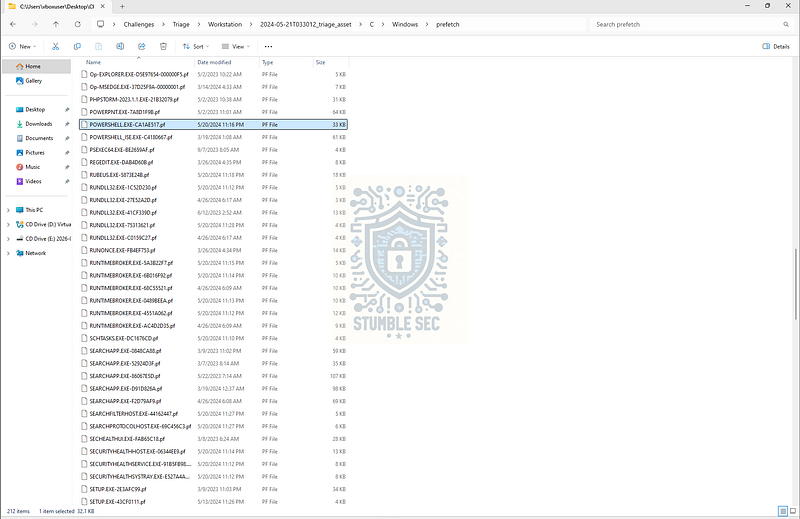
The contents of the prefetch folder
Enter PECmd, one of the many tools in Eric Zimmerman’s suite. It’s built to parse the prefetch logs and it’s already loaded in the analysis environment, so we just need to run it from PowerShell. Here’s an example command where we tell PECmd to parse the prefetch directory and output to a CSV called investigation.csv:
To do that, we’ll use PECmd, one of the tools in Eric Zimmerman’s forensic suite. It’s specifically built to parse Prefetch files and extract execution metadata, and it’s already available in the analysis environment.
From PowerShell, we can run the following command to parse the Prefetch directory and export the results to a CSV file:
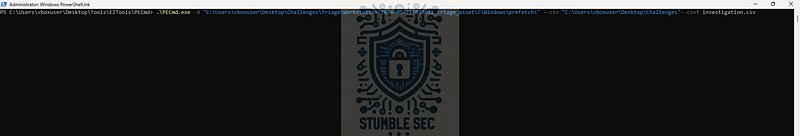
.\PECmd.exe -d “C:\Users\vboxuser\Desktop\Challenges\Triage\Workstation\2024-05-21T033012_triage_asset\C\Windows\prefetch" –csv “C:\Users\vboxuser\Desktop\Challenges”–csvf investigation.csv
Once the CSV is generated, we can open it using Timeline Explorer, another Zimmerman tool that makes sorting and filtering forensic timelines much easier.
Inside Timeline Explorer, focus on the Executable Name column. This is where we’re looking for the tool responsible for the Kerberoasting activity. Scanning through the results, one name immediately stands out among the normal background applications. Can you spot it?
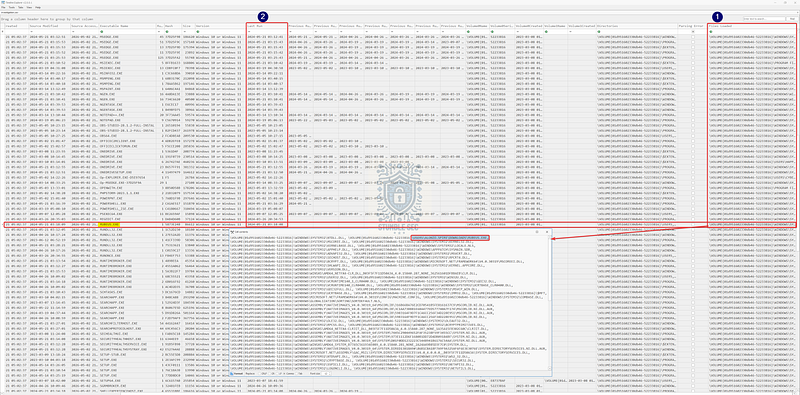
Timeline Explorer: Finding the tool that performed the kerberoasting and the time of execution
The tool is Rubeus (S1071), a well‑known Kerberos abuse tool frequently used to perform Kerberoasting, ticket harvesting, and other Kerberos‑focused attacks.
Rubeus _Edit description_attack.mitre.org
To determine the full file path, select the Files Loaded column for the Rubeus entry and double‑click it to open the detailed view. This reveals the full path used when the executable was launched. Since Prefetch paths are recorded relative to the drive, we simply need to prepend C:\ to reconstruct the complete path to answer Question 6.
Finally, to answer Question 7, we can pull the execution time directly from the Last Run column in the Prefetch data. As with earlier steps, this timestamp is recorded in UTC, so no time zone conversion is required.
At this point, we’ve identified the exact tool used to dump Kerberos service tickets, confirmed where it lived on disk, and pinned down when it was executed, neatly closing out Questions 6 & 7 and our investigation. Nice job!
Conclusion:

Great challenge, how fun was that? A huge thank you to Hack The Box for another awesome challenge.
This lab ended up being a good reminder of just how much signal exists in event logging if you take the time to really understand how domain authentication works. Kerberos isn’t new, and Kerberoasting isn’t either, but walking through the mechanics step by step makes it clear why weak service account hygiene still represents real risk in modern environments. Nothing wild here, just attackers leveraging expected behavior in ways defenders need to anticipate.
What I appreciated most about this challenge is that there wasn’t a single log or artifact that magically answered everything. Instead, we had to move between Domain Controller security logs, PowerShell operational telemetry, and workstation artifacts like Prefetch. Each source gave us part of the picture, but none of them stood on their own. Correlation is key.
Leveraging MITRE ATT&CK as a reference point also paid off here. Rather than hunting randomly, it helped home in on what to look for, why certain events were important, and how those signals might translate into detections later on. This is the kind of challenge that quietly reinforces how ATT&CK can guide both investigations and detection engineering without forcing the analysis into a rigid mold. Awesome stuff.
If you got something out of this walkthrough, whether it helped you better understand Kerberos abuse, work through a stumbling block, or just served as a practical reference, feel free to give it a clap and follow along. I really appreciate the support, and I hope these write‑ups continue to be useful.
Remember, cybersecurity is a team sport, and we’re in this together.
Until next week’s challenge, stay curious and be safe out there.

Tools & References:
Challenge Link: https://app.hackthebox.com/sherlocks/Campfire-1?tab=play_sherlock
Flare-VM: https://github.com/mandiant/flare-vm
MITRE ATT&CK — Steal or Forge Kerberos Tickets: Kerberoasting(T1558.003): https://attack.mitre.org/techniques/T1558/003/
Microsoft — “Microsoft’s guidance to help mitigate Kerberoasting”: https://www.microsoft.com/en-us/security/blog/2024/10/11/microsofts-guidance-to-help-mitigate-kerberoasting/
Event Log Explorer: https://eventlogxp.com/
Microsoft Learn — “4769(S, F): A Kerberos service ticket was requested”: https://learn.microsoft.com/en-us/previous-versions/windows/it-pro/windows-10/security/threat-protection/auditing/event-4769
MITRE ATT&CK — Software — PowerSploit (S0194): https://attack.mitre.org/software/S0194/
Magnet Forensics Blog — “Forensic Analysis of Prefetch files in Windows”: https://www.magnetforensics.com/blog/forensic-analysis-of-prefetch-files-in-windows/
Eric Zimmerman’s Tools: https://ericzimmerman.github.io/#!index.md
MITRE ATT&CK — Software — Rubeus (S1071): https://attack.mitre.org/software/S1071/